December 2022 Almond Market Report
Industry Position
California almond handlers shipped over 206 million pounds in December. This was the second largest December on record falling below only the pandemic fueled 2021/21 crop year. This number exceeded general market expectations and commodity prices have already seen a small bounce of around $0.03-$0.05 per pound since the figures were released.
Crop receipts slowed a bit and lags behind last year by -10.56%. At that pace the 2.6 billion pound Objective Forecast is well within sight. A lighter crop might suggest that available stockpiles may be smaller than last year, but a figure below 2.5 billion doesn't seem all that likely, which should quell any lingering concerns about a further shortening of the supply.
Around the World
India continued its strong pace of importation topping 33 million pounds once again in December. While this is flat from November figures, the pace is +37.5% YoY. India now has back to back months exceeding +26% YoY growth and is now just -9% on net for the crop year after being off by as much as -17% in October. This pattern coincides well with the early Diwali and reports that India had been hand-to-mouth suggests that the subcontinent could be positioned for continued acceleration.
Western Europe has been a mixed bag of late, but all six of the largest markets (Spain, Germany, Netherlands, Italy, United Kingdom and France) posted positive growth YoY in December. As the region’s largest market, Spain is growing at a +17% annual rate and has topped 78 million pounds through the first five months of the crop year. France is showing the largest growth of any Western European market with a +22% annual rate and is now on par with the UK regarding import volumes with 9.1 million pounds on the book thus far. The UK continues to struggle to keep pace and is off -24% on the crop year. Italy is the only other major market with a negative annual growth rate at -5%. On net, Western Europe is now +1% ahead of where it was last year reversing the -4% pace the region was on back in November by importing +22.9% more in December YoY.
The Middle East is having its moment, at least from a growth perspective. Through the first five months of the crop year, the region’s top markets (UAE, Turkey, Jordan, Saudi Arabia and Israel) all continue to show strong growth. On net, the region is up +38% on the crop year having imported +33.8 million more pounds than a year ago. As the region’s largest market, the UAE is growing at a +34% annual rate and is only -1.8 million pounds behind China, itself the 3rd largest export market for California almonds (Current rank: India, Spain, China, UAE). Turkey, Jordan and Saudi Arabia also have impressive annual growth rates currently posting +25%, +129% and +89% respectively.
China continues to be sluggish with its inshell imports. The -24% annual growth rate is comprised almost entirely by a short fall of inshell pounds, which are off almost -20 million pounds through the first five months of the crop year. By comparison, kernel shipments are less than -400 thousand below last year’s figure. This trend has been present for some time and seems to be continuing; however recent reports suggest that interest from Chinese inshell buyers has surged of late. While we expect kernel shipments to continue to be on par, inshell shipments may be poised to rebound in the New Year.
Domestic Shipments dipped -18.4% in December YoY and was the lightest December since the 2016/17 crop year. On net, shipments are down -8.72% on the crop year. At the current growth rate, domestic shipments are currently on pace to fall below figures from the 2017/18 crop year and below 700 million pounds.
Drought
California’s rainy season has been, well, wet. This is a welcome development and change from the particularly dry winters of the past several years. December started wet, dried out, then finished wet again, and January has so far continued the wet pattern with hardly a day without precipitation somewhere in the state. In fact, recent storms have caused widespread flooding concerns with areas in the valley, like along the Consumnes River and coastal areas have seen significant damage as well. Designated overflow areas along the Sacramento River have also been engaged due to high river flows - further evidence that the Golden State has been seeing its fair share of rainfall of late.
Rainfall totals are well above average for this time of year. According to ggweather.com, Sacramento State University weather station has seen over 200% of average rainfall. Other stations in the Central Valley like Modesto, Stockton and Merced are also all reporting totals over 200% for this time of year. Further south, Fresno is at 198% while Bakersfield is at 121%. These are encouraging figures, but California’s primary rainy season runs through April and with much of the season left, it is important to remember that a shift to drier conditions could quickly erase the surplus. Of the previously mentioned weather stations, none have reached their full season averages yet with Modesto being the closest at 91% of its seasonal average. We also saw last year that a strong start to the season doesn’t mean we’re safe from another year of drought.
California’s snowpack has also benefited from the series of recent storms. California’s snowpack provides upwards of 30% of the entire state's water supply and helps lock water reserves away until warmer temperatures arrive helping maximize the retention power of its reservoirs. Statewide, the snowpack has topped 226% of average for this time of year and is now 102% of the average pack on April 1st. The Southern Sierra are leading with 269% of average as of Jan 11th. The North lags, though still impressive with 184%.
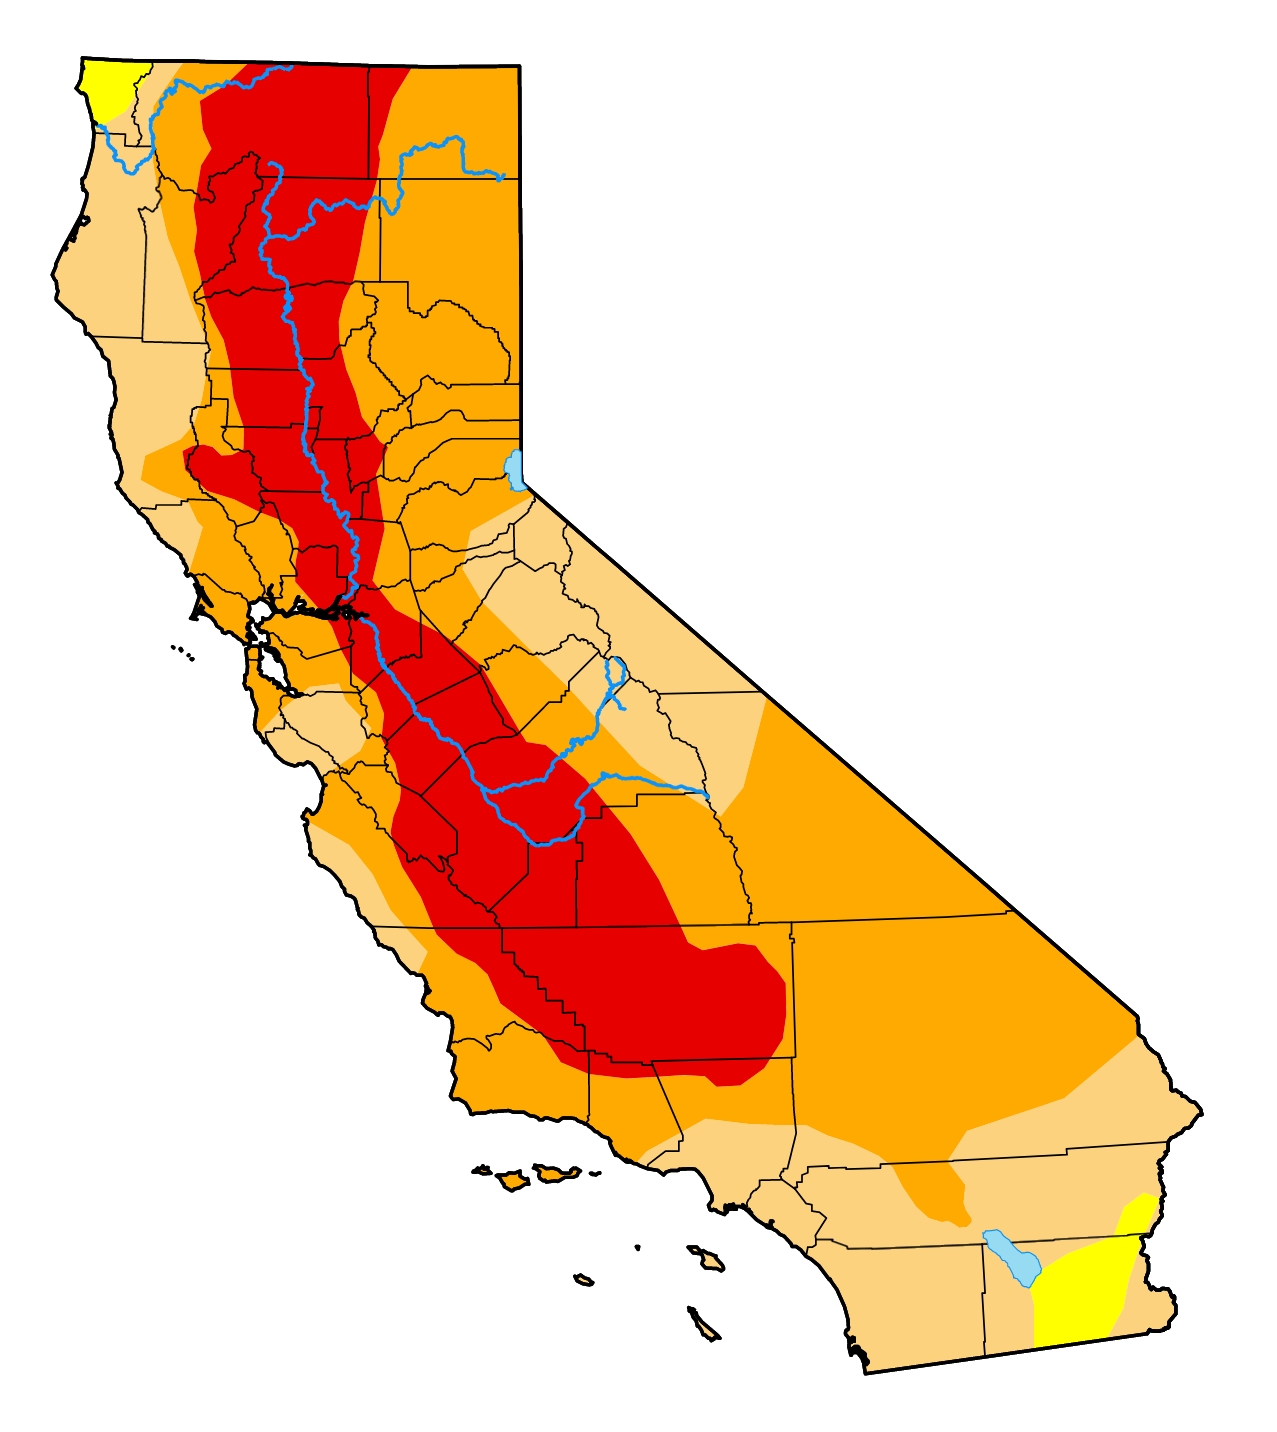
But it’s going to take more to get the state out of drought and replenish its reservoirs. According to droughtmonitor, the entire valley encompassing California’s almond growing region is still experiencing Extreme Drought conditions.
A Bloomberg article also recently pointed out that “years of pumping ground water has led to a collapse of underground chambers where water was held and the sinking of lands on the surface. Those underground pockets may never come back.” In short, additional rainfall and time is needed for the drought to be abated.
While flood has become an issue in the state, the largest reservoirs remain well under capacity. The two largest, Shasta and Oroville, are both under 50% of their total capacities and at 70% and 88% of historical averages respectively. That said, the recent storms have had significant impacts on these two reservoirs with Oroville seeing its lake levels rise an astonishing +62 feet between December 26 and January 9th with Shasta seeing +21 feet in that same time frame. Smaller facilities like Folsom however have had to increase their releases with recent inflows to ensure enough capacity for future storms sending excess water out to sea.
Make no mistake, the recent string of wet weather is welcome news to the drought stricken state, but the season is far from over and many have already made it clear that much more wet weather is needed to fully replenish the reservoirs and elevate the drought conditions. While the immediate forecast does call for continued rain, recent years make it clear that the weather can turn dry as quickly as it turned wet.
Market Conditions: All Eyes on Demand
Benchmark commodity prices for almonds have been softening since November and crop receipts seem to indicate that the crop yield will come in between 2.5 - 2.6 billion pounds meaning that the industry continues to be in an oversupply scenario. Total committed shipments total just over 719 million pounds which is -11.26% behind last year. New commitments in December almost reached 235 million pounds, which would exceed any December except last, but instead falls -4.8% short. While the December figure was solid, we aren’t yet seeing a quickening pace that would signal to us a demand scenario beginning to balance supply.
Shifted Demand
Speaking of demand scenarios, let’s revisit the shifted demand cycles that we have periodically referenced and last touched on in our September 2022 Market Update and as far back as December 2021
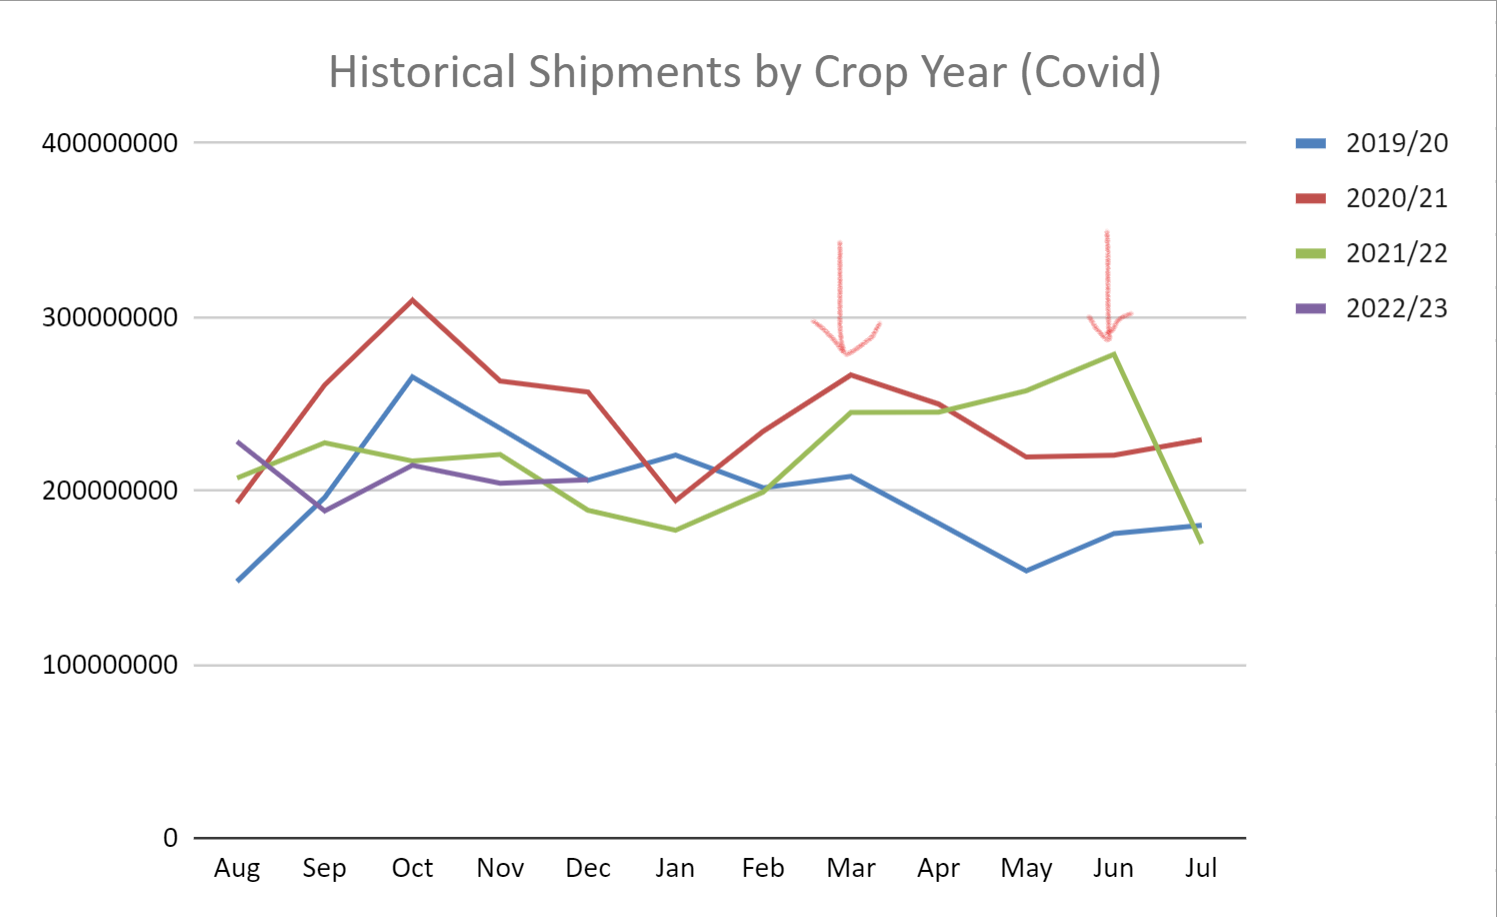
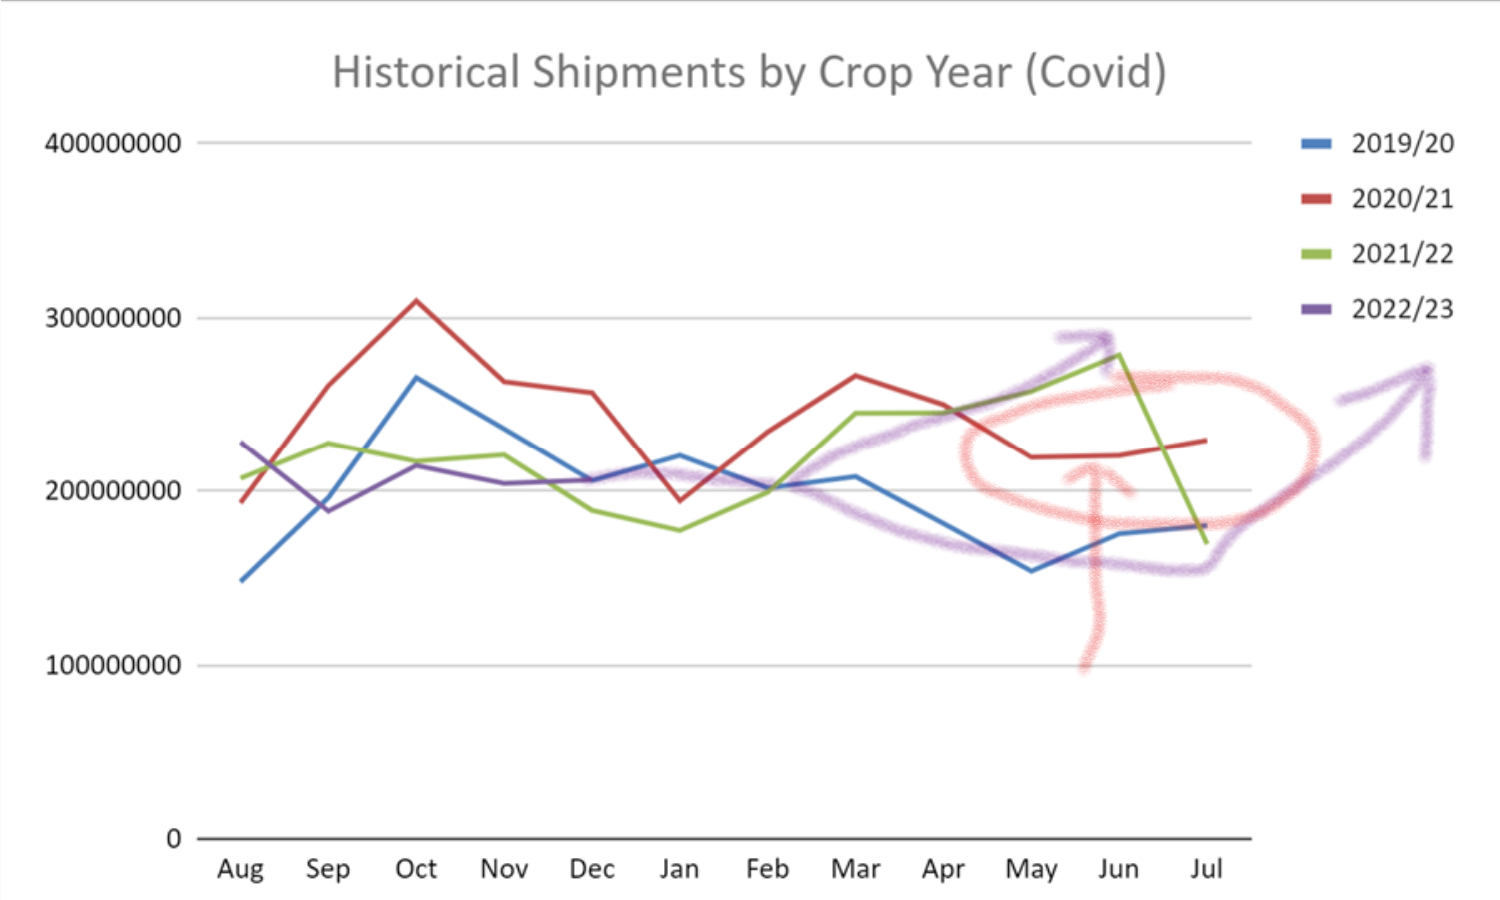
Briefly summarizing, historical shipment peaks have occurred annually in October. Beginning in the 2020/21 crop year however we saw a peak in shipments occur in March with no peak in the following October. Subsequently, the 2021/22 crop year saw a spring push with shipments peaking in June. Here's a chart showing monthly shipments by standard crop year. Notice the spring and summer peaks occurring outside of the historical October window represented by the 2019/20 crop year.
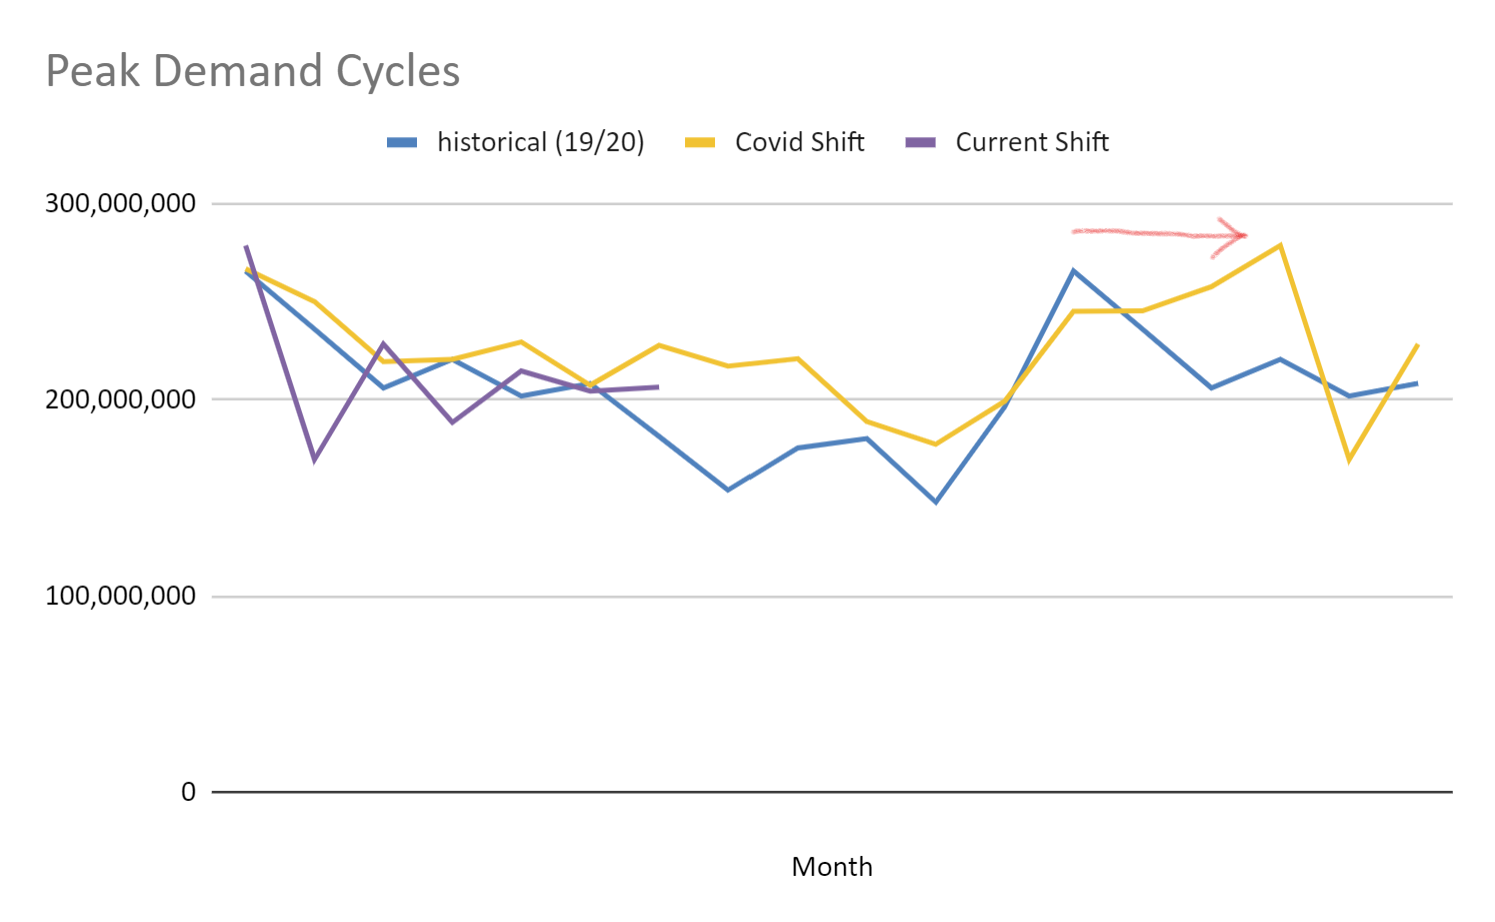
Charting these peaks together has helped us put in perspective the relative position of the industry rather than trying to compare a given month to its calendar-based partner. The chart below takes each peak and trends the following 8 months with each beginning at their peak rather than the actual calendar months to provide an even comparison. The historical trend is represented by the 2019/20 crop year October - June. The 'Covid Shift' begins in March of 2021/22 crop year while the ‘Current Shift’ is the peak the industry saw back in June 2022 and continues to date with the last two data points still in the future.
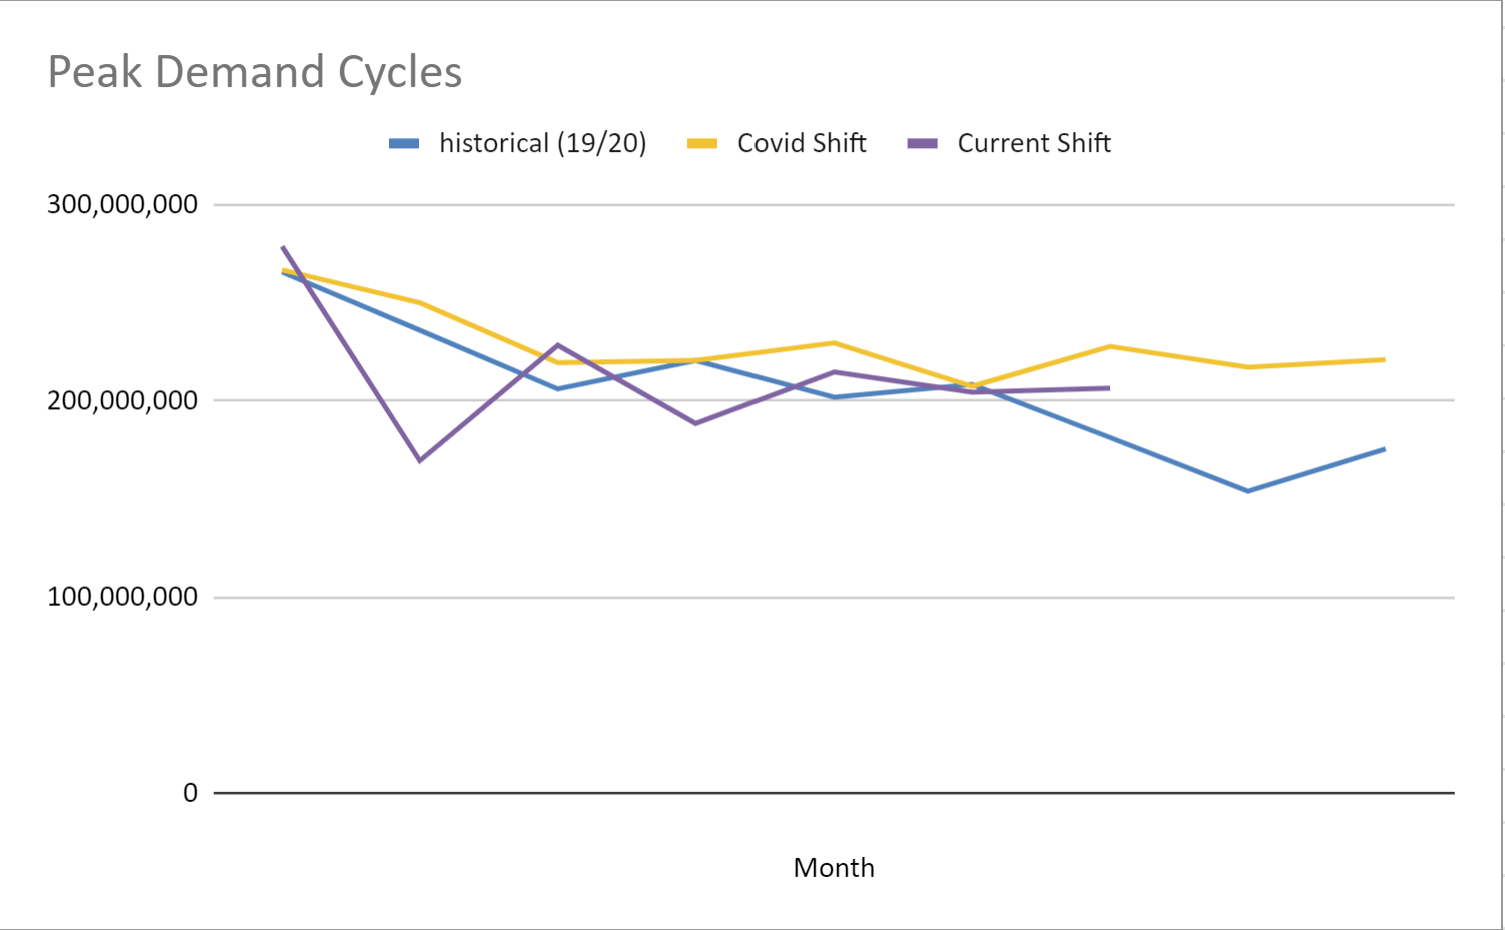
What you’ll notice is that these trend lines generally follow a similar trajectory. We noted previously that Industry expectations were below the 206 million pound shipment number we saw in December, but this chart suggests that perhaps the expectations should have been adjusted as the number in fact fits quite well within trend. That said, on net, the current line is currently -1.9% below the Historical and -8.1% below that of the Covid Shift. Thus even by this means of comparison, current demand seems to be softer than in the past.
Another possible headwind to a rebound in demand is the changing pattern at which we’re observing the occurrence of peak shipments. The chart below extends the previous trend lines presented above to include 18 months. This helps better visualize the long trends and spot the shifting re-occurance of peak shipments.
We have long proposed that logistical disruptions brought on by covid caused the first shift back in 2020/21 and that the additional shift we saw in 2021/22 was the cycle reverting slightly back to normal as supply chain issues eased. If this is true, then we must ask ourselves what would happen if global supply chains were able to fully recover and purchasing cycles reverted all the way back to pre-pandemic patterns? Would the next shipment peak not occur until October as historically it would?
Excuse the crude graph, but here essentially is the question we're trying to ask. Will shipment figures follow then trend of last crop year or are we reverting back to historical patters. Both are sketched on the first chart we presented showing shipments by crop year. There is a big gap in shipments between these two scenarios.
This is of course is yet to be seen, but the industry could very well enter the spring and summer lagging behind shipment figures seen in the covid impacted years and that would continue the oversupply scenario well into the future. Eventual water supplies, while looking improved, and bloom conditions will be the two other variables most likely to change the balance between supply and demand. We’ll continue to monitor as the season progresses, but for now conditions favor the buyer.