September 2022 Almond Market Report
Quick Glance
The September Position Report shows shipments topping 188 million pounds. This is down -17.2% YoY and -40 million pounds less than August. Domestic shipments were off -19.3% accounting for less than 52 million pounds. This was the smallest shipment month for the domestic market since the Industry shipped 50 million pounds in September 2018. Export markets were also off, declining -16.4% YoY. Through the first two months of the crop year, the Industry is down a collective -4.21%.
Committed shipments lag -7.59% from this time last year nearing 666 million pounds. New monthly commitments in September were up YoY however adding 240 million pounds (+3.5%).
Crop Receipts have topped 978 million pounds closing the -15.19% YoY gap seen in August, but remains behind last year by -8.41%. Receipts for the month of September were off by -5.6% YoY. Uncommitted inventory, due to the historically large carry forward, exceeds last year by +42.77%
Supply and DEMAND
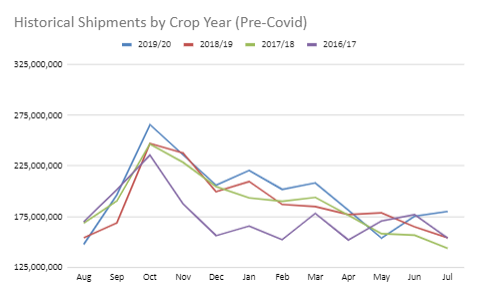
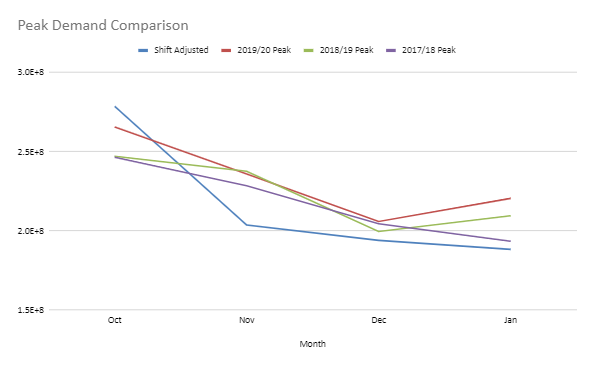
Peak shipments for a given year have historically occurred during the month of October, then tapered off before cycling again. While a simplification of demand cycles, the chart below clearly illustrates this pattern:
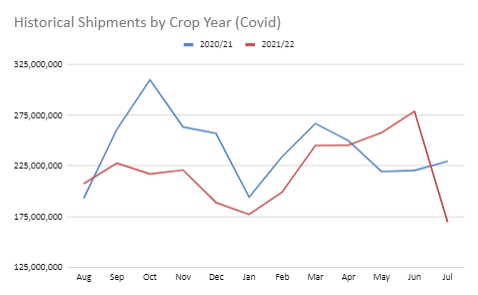
The 2020/21 crop year began with a similar trend line, but a secondary demand spike emerged in the spring. You see a very similar shift in the 2021/22 shipment trend as well. Here they are together:
This spring demand spike is something we’ve discussed several times and as far back as December 2021. We have speculated that what is occurring is an industry-wide shift in buying patterns, including peak demand. We’ve postulated that this has been driven by logistical uncertainties fueled by covid disruptions; however, this is admittedly oversimplified and not easily discerned. So rather than continue to explain nebulous causes, we thought we take a closer look at whether the shift in demand is actually continuing to happen as we had speculated.
Charted below is the October thru January shipment periods from the three crop years prior to the bulk of covid influences. This represents the peak demand month and the general tapering thereafter. Also charted is the past four months (June – September 2022), but charted so the peak in June coincides with the historical peaks seen in October.
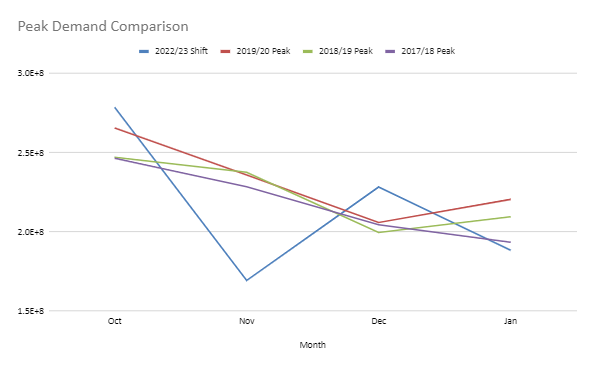
The past four months show more variability, but this could be partially explained by port closures we saw July. Should we want to consider possible shipment impacts due to port closures, we adjust revise July’s numbers up and August’s down by 15%. That would look like this:
The take away here is that the past four months shouldn’t be viewed as all that dissimilar to a historical October thru January demand cycle. And as such, here is maybe what our October 2022 shipment month might look like:
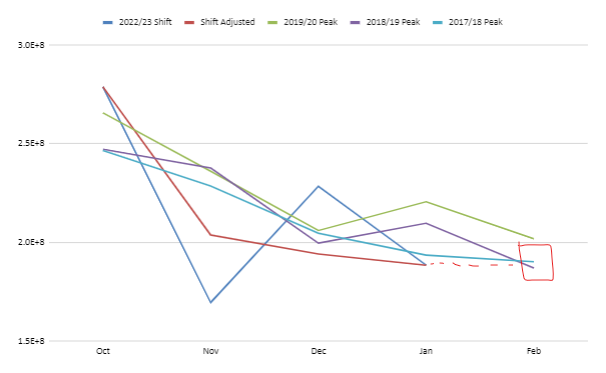
Average shipments for a typical February in the chart above is 192 million pounds. Does that mean the Industry is going to ship 192 million pounds in our hypothetical February (Oct 2022)? Probably not, but let’s also consider that those same crop years had seen an average of 253 million pounds at their October peaks, so then should October 2022 see a similar shipment number? No, but if nothing else, this exercise is meant to highlight the reality that the current demand cycle we are seeing in 2022 has shifted from historical averages and would suggest we’re going to be a lot closer to the 192 million number than the 253 million number looking ahead to October’s Position Report – that much we’re willing to stake a claim to.
But of course we’ve all heard this notion of shifted demand before (everyone reads our reports right?). So then, let’s assume all of this the markets have accounted for, the reality is we’re still oversupplied compared to historical averages right? That’s rhetorical, but the answer is yes. And we’re in harvest so the expectation is more and more supply will become available in short order. This is what is keeping prices low. Until the perception of an oversupply diminishes, prices will remain depressed.
Supply
So, let’s examine supply. Field reports are not an ideal source of data for mathematical modeling. Subjective input is subject to all sorts of biases, but when aggregated we can at least look hypothetically based on some ‘educated guesses.’ From our standpoint, we can say with relative confidence that the North Valley has been severely impacted by early season frosts. Yields are off -50-60% with many younger and marginal orchards being left unharvested all together.
The Central Valley has avoided the same fate as the North with some orchards reporting yields on par with last year. But the orchard reporting a growth in receipts is few and far between. On average, the rule of thumb seems to be an expectation of a reduction in yield of -15-20%.
Heat and water stress have suppressed the South Valley’s yield potential, but not in the way that the frosts up north impacted those regions. Kernel size has been smaller and where water stress was particularly dire, yields are down. But, by how much, might be hardest to assess by a word of mouth survey. We still believe there could be more downward risk than not, but for now, let’s assume that the South Valley’s yield will be on par with last year. Where would that leave us?
If we use -50% in the North, -15% in the Center and EVEN in the South, we gross 2.55 billion pounds. If we consider the lower end of the ranges for the North and Center the crop falls to 2.48 billion. If the South does in fact come in shorter than last year, well I think you can see where that might lead us. That said, a 2.55 billion harvest, less loss and exempt (-2%), plus our carry-in would net a total supply of 3.34 billion pounds. Compare this to the 2.92 billion crop last year, less loss and exempt plus the carry forward a year ago. Total supply last year was 3.47 billion. Therefore, at a 2.55 billion pound harvest, total supply, even with our historical carry forward, would actually be down -3.75%. A shrinking total supply only accelerates if more aggressive reductions in regional yields are assumed in the previous model. Here we’d encourage you to do your own surveying and play with the model using your own numbers.
Are Commitments a Problem?
One way to interoperate the September Position Report would be to look at both committed shipments and uncommitted inventory and conclude something to the effect of: ‘we have more supply, but has less of it sold – supply and demand must be out of alignment.’ Suppressed prices would also support this position. Commitments aren’t quite that binary though, as they forecast future demand. We like to look at newly added commitments within a month which, while not reported on the Position Report, is easy to calculate. This at least can indicate current appetite for product at the current prices. August and September numbers have been within historical averages. July was perhaps the only recent month out of average ranges. Where the difference can really be seen is in May as shown in the chart below:
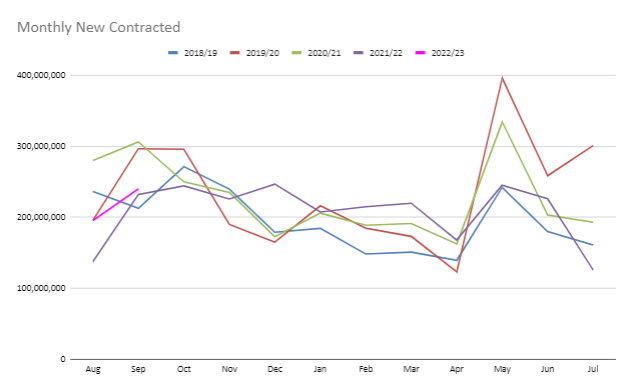
May is the first month new crop commitments are reported on the position report. May probably doesn’t itself actually see this huge spike, but appears as such as previous commitments become accounted for. What this suggests is that there has been a long lived hesitancy for overextending commitments on new crop. This can be explained by the large carry forward of course, but could also be influenced by the expectations of a short crop. Frost issues and drought concerns are nothing new for the crop year and growers have long been expressing concern for more downside to yield than upside. Being cautious not to overextend commitments on a short crop year is a very prudent strategy and we may be seeing this play out.
We would expect average new monthly commitments to continue. Any hesitancy to book new business will be balanced by the reality that buyers are historically under committed – both sides will need to do business. Acceleration in commitments doesn’t seem likely however. Any acceleration of demand that low prices may bring will likely be outweighed by handler caution as the Industry waits for a clearer picture on harvest. If handlers continue to see downside in yield we could even see commitments slow as the expectation of higher prices would favor a patient handler. But even a patient handler will need to balance cash flow and space meaning steady-as-she-goes for at least another month or two while receipts are tabulated, or so we might suggest.
Market Review
India has struggled to maintain last year’s pace through the first two months of the crop year. The market was down -38.6% YoY in September and is down -39% for the crop year. An early Diwali season saw shipments accelerate at the end of last crop year. The market appears to have needed some time to work through this glut and we expect the sub-continent to begin to rebound in the coming months. A weak rupee does pose a threat to strong demand increases, but the historically low market prices still make almonds attractive. Should prices move upward, this could help local traders move latent inventory and fuel some short term growth as well.
We have observed active interest from the Chinese market. Interest doesn’t always translate to demand, but there is reason to be optimistic in this market. Down -7% on the crop year, kernel imports are actually up +17.9%. Inshell shipments could be waiting for incoming crop and we’ll watch to see whether a rebound occurs in October forward.
Western Europe is up +2% on the crop year with France, Germany and Spain seeing growth of +25%, +13% and +10% respectively. Italy and the Netherlands, which round out the top 5 submarkets, saw growth of +0% and -16% respectively. We have seen some large month to month variances within specific markets and have talked about them in previous reports, but on the whole we see strength in the region.
The Middle East continues to show exceptional growth. Up +65% on the crop year, the region posted +24.9% growth in September YoY. The UAE, as the largest market in the region, has topped 10.8 million pounds thus far this year with a growth rate of +39%. While the UAE was essentially even YoY in September, several other countries saw truly impressive growth rates. Saudi Arabia, Jordan and Turkey all imported more than 1 million pounds each in September with Turkey importing over 2.7 million pounds. These represent growth rates of +66.7%, +90.0% and +93.7% respectively. Growth in the region is being fueled entirely by kernel imports with inshell shipments near par for the region on gross.
The North Africa region, driven largely by Morocco, imported over +1 million more pounds this September than a year ago up +152.3% and is pacing +380% through two months of the crop year. South Africa has also performed well, topping 3.4 million pounds through two months and posting a +368% growth rate. These markets could very well prove to be growth markets for California almonds in 2022/23, but we will continue to monitor to see if a trend truly develops.
General economic headwinds facing the global economy are something to consider. Energy costs are likely to remain elevated, inflation has been a target of many central banks and has been impacting consumer wallets and talks of global recession seem to be growing more frequent. While food items are often seen as recession proof and can be leaned on for comfort, financial distress can certainly influence buyer behavior in both mature and developing price sensitive markets.
Bag it, Tag it!
This is where you might traditionally find a neat little summary all wrapped up in a bow. But if you’ve made it this far, you probably know as we do that rarely do markets fit nicely into a gift wrapped box. So instead, we extend an invitation. Come talk to us. Our team will be in France at the Sial Paris tradeshow and we’d love to hear your thoughts on the market. And for those that will attend, a special offer: mention to the Sales Team on site that 10 push-ups are on offer for your market insights. If your input sparks interest, we’ll drop and give you ten right there on the expo floor. As a bonus offer, send a video of our sales team performing these pushups to info@selectharvestusa.com and the author of this report will reciprocate 2:1. #AlmondWorkout!