January 2022 Almond Market Update
State of the Industry
January's Position Report shows that crop receipts on the year have exceeded 2.8 billion pounds. Over the last three years, the industry has found itself to be between 97% and 99% received through January. This would project total receipts between 2.85 and 2.90 billion pounds. Accounting for loss and exempt at the industry standard 2%, this should put the marketable receipts on the crop year between 2.80 and 2.85 billion pounds. This is relatively in line with the Objective Forecast’s 2.8 billion estimated in July.
YTD shipments remain off -16.17%, though this is an improvement from December where the industry was off -17.29%. The 177 million pounds shipped in January was the slowest January since the 2016/17 crop year and -8.8% below that of last year. This YoY decline does however end a four-month streak of double-digit declines YoY.
New commitments in January remained strong by comparison surpassing last year’s figures. Total committed shipments now trail last year by just -9.73% through January, which was off by as much as -34% YoY in September.
What Does the Future Hold?
Projecting the future is a fool’s errand, but looking forward is something that we all nevertheless endeavor to do. The clear fact remains that the Industry as a whole has a lot of inventory to sell to achieve a comfortable surplus through the late summer transition. Historically speaking the industry is significantly under sold at this time. This is going to continue to add downward pressure to prices; however, last month we postulated that historical buying cycles may continue to be affected by the logistical pressures of ongoing Covid restrictions and labor impacts as well as supply chain bottle necks. This might foreshadow strengthening demand through the reminder of the crop year.
If you missed last month’s report, view it HERE reading the ‘Another Perspective on Demand’ section. It will help contextualize the thought-experiment that follows.
As a brief synopsis the scenario explored last month assumed a 5 month shift from historical buying trends which would lead us to compare January’s shipment numbers with those historically of August – traditionally one of the slowest shipment months of the year. But what would that look like if we projected forward assuming such a shift in buying patterns?
In such a scenario, the shifted shipment figures continue onto the line labeled 'Hypo 2' where January's shipment figures are now represented in August. In evaluating the last five months of the '5 Month Shift' line and now the first data point on the 'Hypo 2' line, we see an average growth rate against historical average of +21%. A +21% growth rate by any measure is aggressive and easily dismissed, but is such a growth rate actually out of line? When graphed along side the 2020/2021 crop year, the projection forward on 'Hypo 2' aligns quite well with the numbers we saw in 2020/21 before we're assuming buying habits began to shift. This makes one question the validity of simply dismissing such a growth rate as being to aggressive - it's happened before. Wherever you stand, here's the graph for your consideration:
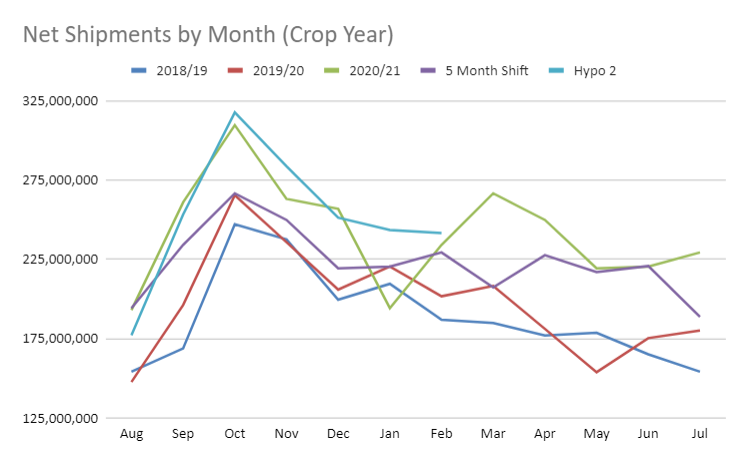
A chart alone does not suggest such a scenario will come to pass; but, it does present an interesting mind-exercise to consider. It could however help rationalize the accelerated rate at which the industry would need to sell in order to bring transition inventory inline with historical comfort. Consider that under the hypothetical trend, selling the proposed amounts through the end of the crop year would yield a carry forward number in the 630 million pound range putting the industry at a 22% stock to use ratio. This would fall within range of the 20% target we’ve historically assumed as a neutral figure. Compare that to a carry out of nearly 800 million pounds that would be projected assuming the Industry shipped the same figure as last year February forward. It becomes easy then to imagine the industry experiencing significant bearish pressure on price. So the question between now and then remains: Is pending demand going to carry the market or is perceived over supply going to lead? Time will tell.
Drought
After an up and down start to the season that saw a particularly wet December, January came and went as one of the driest January’s on record. As reported by ABC10, most locales in California saw only trace amounts of rainfall in January. Sacramento as an example saw just .05” of rain in January. While not the all-time driest, Sacramento averages 3.9” for the month. This was a common thread throughout the state clearly illustrating that this dry pattern is historically unusual.
Year to date rainfall totals, that had just a month ago been solidly over 100% of normal, have declined as a result. While some locales still hold above 100% for this time of year, the Northern and Central regions on aggregate sit at 96% and 98% respectively. Historically speaking, California still has a significant portion of the wet season ahead, but the region desperately needs a well above average water year to recover from historical drought conditions.
As of Feb 10th, 66.4 % of California remains in ‘severe drought’ conditions as defined by drought.gov. This includes the entire almond growing region. And as further evidence that an above average precipitation year is needed, California’s reservoirs remain well below average for this time of year. Lake Shasta, California’s largest reservoir, sits at just 54% of average for this time of year. Its sizable sister to the south, Lake Oroville, is fairing a little better at 74% of average YTD; however, of the nine reservoirs of at least 1 million acre feet capacity that supply the central valley during the summer, only two are above 50% of full capacity (Don Pedro 54% and Berryessa 67%) – Water.ca.gov.
Low lake water levels could be mitigated by sizable snow pack measurements since most of these reservoirs rely on spring snow melt to fill. However, a dry January, and now a historically warm February, are accelerating snow melt without new snow to replace. As of Feb 10th the statewide snow pack is 80% of normal and just 57% of average through April 1st – Water.ca.gov. While February and March can be historically wet months, mid-range forecasts suggest California will continue to see near record setting warm temperatures and lack precipitation. We may yet again be hoping for a ‘miracle March’ to save our water year.
The Department of Water Resources recently advised water allocations of 15% to local water districts. This is up from the last announced 0% allocation. This was reflective of the early season improvements California water resources saw, but with little relief continuing on the immediate horizon, this number does not seem likely to increase. Furthermore, some districts continue to prepare for a 0% allocation understanding that dire water conditions may still loom. Either way, the water outlook continues to bring forth drought concerns for the upcoming crop year, which already saw many orchards deficit irrigating and/or apply suboptimal water increasing the risk of long-term health issues for trees.
Markets Exploration
Export shipments were off -18.4% YoY in January marking the fifth consecutive month of double-digit shipment declines. This pace does mark a bit of a reversal from the -36.5% market set in December. Export markets remain the greatest opportunity for almond handlers with domestic markets now showing slight growth on the year at +0.33% and +13.3% over last January.
India was effectively on par with shipment figures from a year ago off about -150 thousand pounds. India remains off -20% on the crop year, but this is an improvement over -22% seen last month. The strengthening shipment figures suggests that any oversupply the subcontinent was experiencing may be easing. Prices remain low and buyers are also likely to look to purchase for Diwali early this year. We expect India to continue to rebound.
North East Asia appears to be strengthening as well. China held stead MoM and nearly doubled its imports YoY in January. Japan and South Korea are both up MoM and both are now showing positive growth on the year with Japan pacing +14% and South Korea +2%. Historically a pass-through to China, Vietnam saw growth YoY in January – it’s first positive number on the year and also improving from -33% on the year in December to -28% in January.
Western Europe continues to be sluggish falling from -24% on the year as a region to -26% in January. All markets outside of Denmark, Ireland, Sweden and Switzerland are all under last year’s shipment totals YTD. (For reference, those aforementioned markets account for just 3.4% of all imports on the year.) Of the five largest markets in Western Europe, all but the Netherlands (-7%) are off -24% or more on the year. Not a single one of the top five markets imported more almonds in January than they did in December. That’s not necessarily outside of historical trends for this time of year, but neither does it signal an immediate strengthening of the region.
Last Word
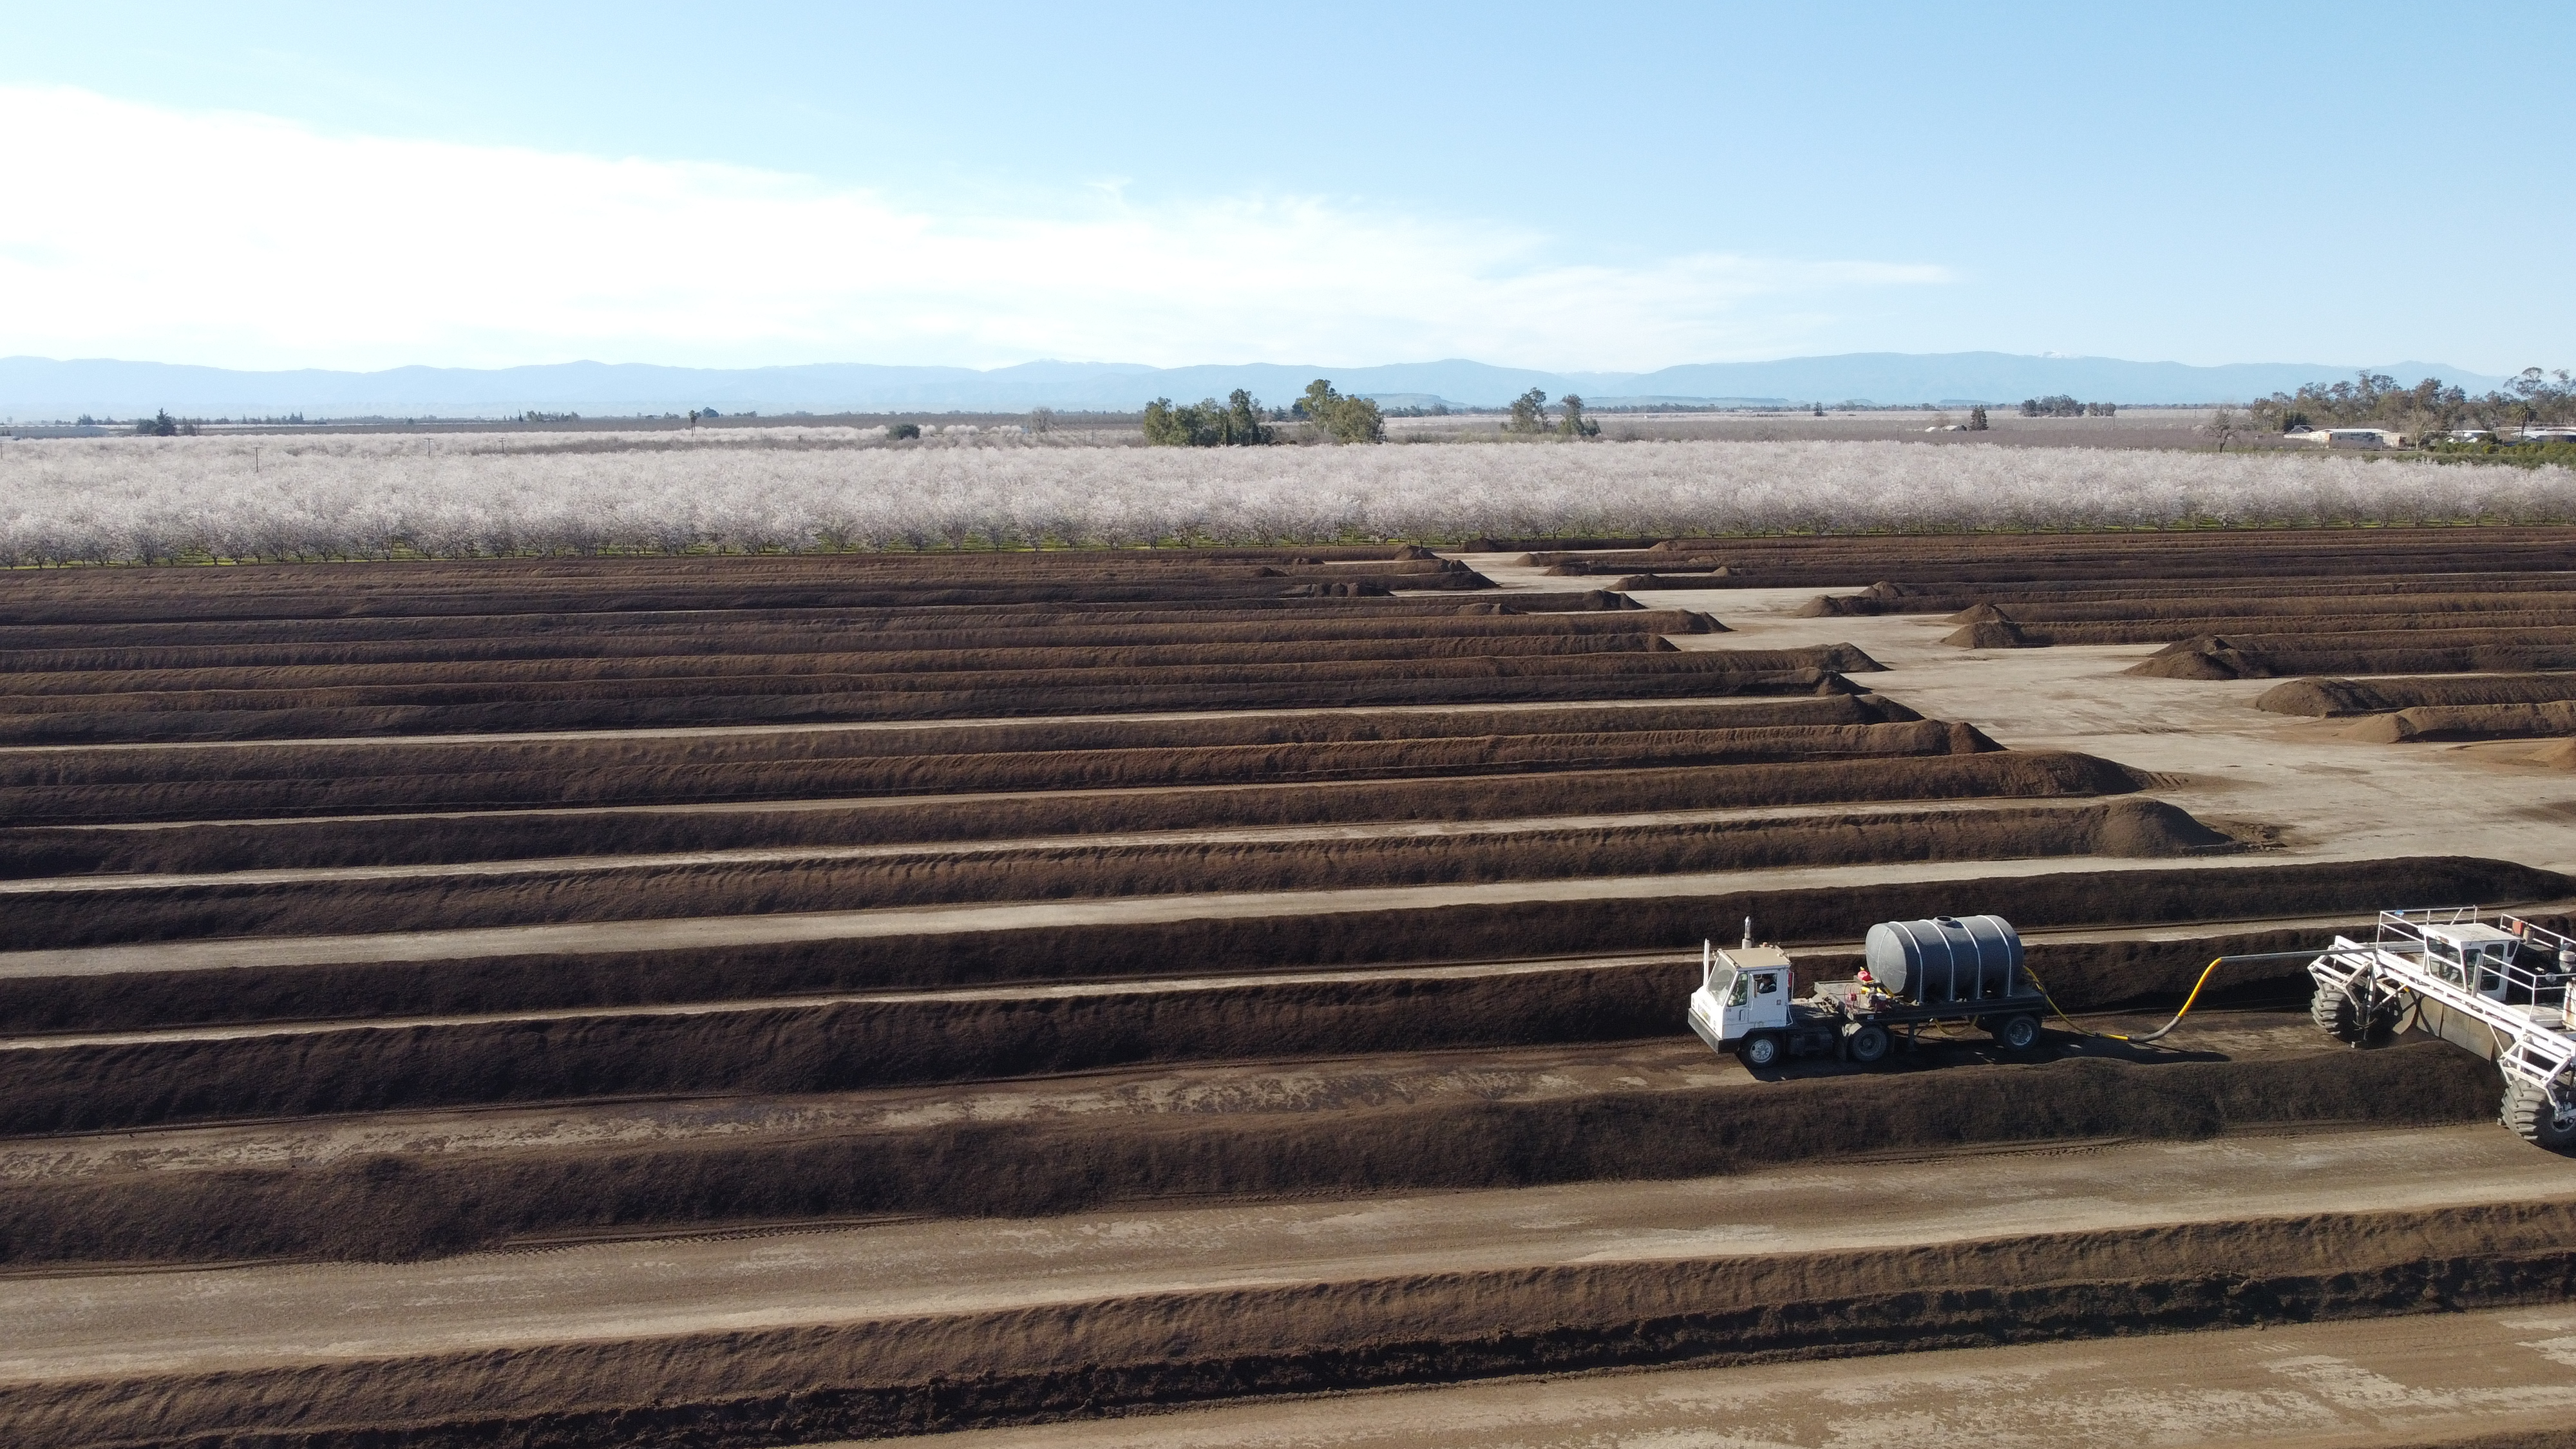
Bloom is upon us and the weather looks fantastic. Historically warm weather and a dry immediate forecast should provide ample flight time for bees to pollinate. It is still too early to speculate on a future crop, but there has been some concern in the southern region regarding new growth and bud wood being impacted by the high rates of deficit irrigation in the region. Water stress can have multi-year impacts and even if the water situation should improve, there is real concern about the yield potential in these already stressed orchards.
And don’t miss our NutNews Podcast. January’s episode explored the use of mason bees in our orchards and is quite timely to the mass-pollination event that is upon us. Come learn about the fascinating role that these solitary bees play in our orchards.