USDA-NASS Acreage Report Trends and Analysis - What it Means for the Almond Industry
USDA-NASS Acreage Report
On Thursday, the United States Department of Agriculture and the National Agricultural Statistics Service released their annual Almond Acreage Report for the 2020 almond crop year. The report estimates total almond acreage at 1,600,000 acres including 1,250,000 bearing and 350,000 nonbearing. This represents a +5.3% increase in total acres over 2019. Bearing acres were up 5.9% over 2019, which fell just below the originally forecasted growth rate of +6.8%.
With just over 3.09 billion pounds received by handlers to date, these acre numbers equate to a 2,475 pounds per acre yield. This is the largest yield per acre since the 2010/2011 crop year. Average yield over the last ten years is 2,192 pounds per acre. The 2020 yield was +12.9% higher than average. Another way to consider this is an average yield on 1,250,000 bearing acres would total about 2.75 billion pounds, significantly less than the 3.09 billion pounds we saw.
This should be kept in mind as crop forecasts begin to come out in the coming weeks and months with a consensus already coalescing around a number well below 2020’s record crop. The USDA-NASS report estimates 2021 acreage to be 1,330,000 acres. A return to average yields would net a crop just over 2.9 billion pounds. In our April NutNews episode, CEO Bob Nunes suggests the industry believes current bud set points us towards a 2.8 - 2.85 billion pound yield. Upcoming Subjective and Objective industry forecasts should help clarify future expectations.
New Plantings
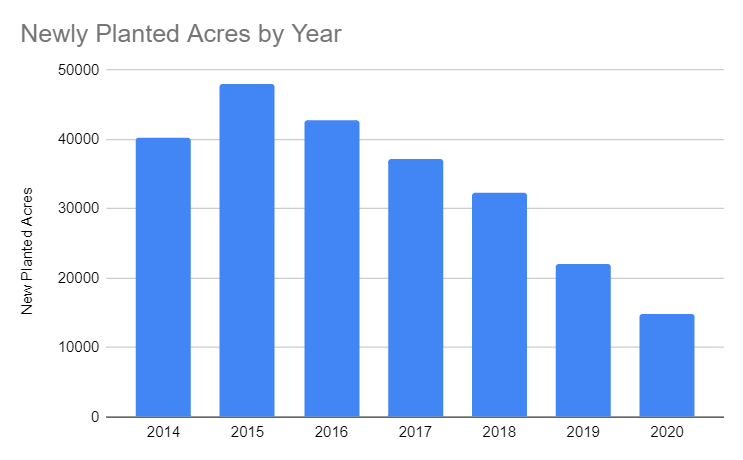
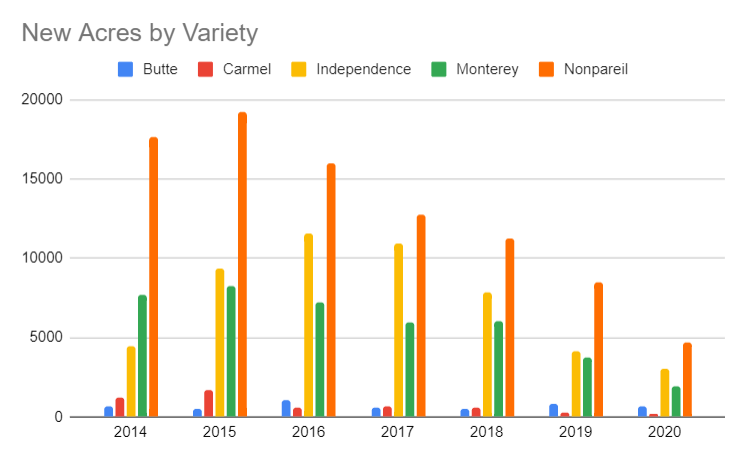
Newly planted almond acres declined for the fifth straight year after peaking in 2015. Nonpareil is still the most frequently planted variety, but the gap between other almond varieties has tightened. However by and large declining plantings have affected all major varieties.
The USDA-NASS report shows planted acres continue to be concentrated in the southern and central regions of California. The top five counties by total acres are Fresno, Kern, Stanislaus, Merced and Madera together account for 73% of the total bearing acreage. This concentration of acres in the Central and Southern counties highlights the potential impacts of intensifying drought conditions as these areas are more susceptible to water insecurity than their northern counterparts.
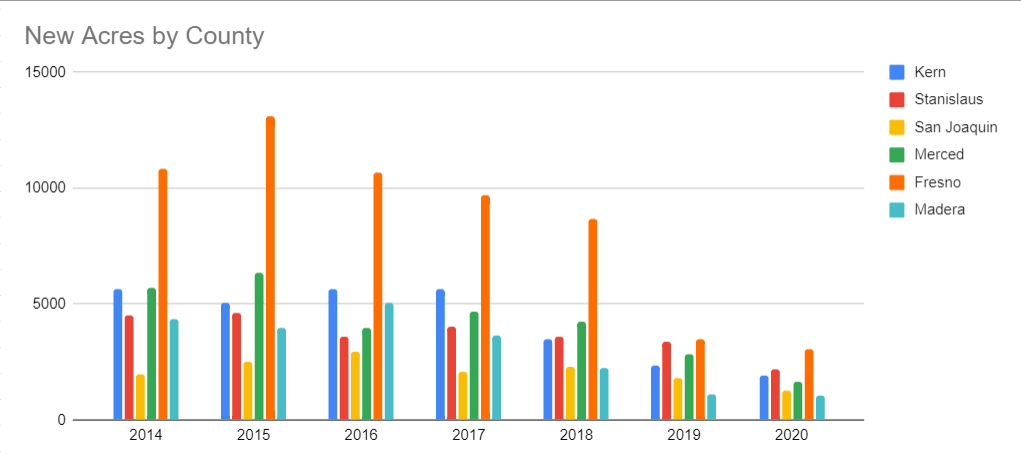
The top five counties by total new acres planted in 2020 are Fresno,
Stanislaus, Kern, Merced and San Joaquin counties. With some fluctuations year
to year the chart above clearly shows the accelerated decrease in new plantings
in these counties. All counties shown have now seen at least two straight
years of declining new acres with most experiencing a longer trend. Fresno
County has seen the largest declines off of it peak over any other county.
A Look by Variety
A declining rate of plantings isn't the only thing we can look at when trying to understand crop dynamics. We should also look at what is being planted as differing rates of plantings in favor of one variety over another will over time alter the mix of available varieties and variety types available to industry buyers. Different ideal use-cases for different variety types means sub-markets can immerge when certain varieties become out of balance with need. To help us understand varietal trends, consider the following charts examining major varieties in the three primary type classifications.
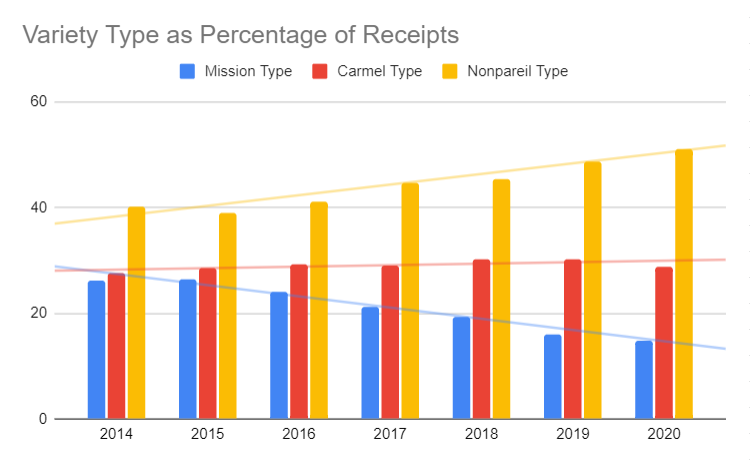
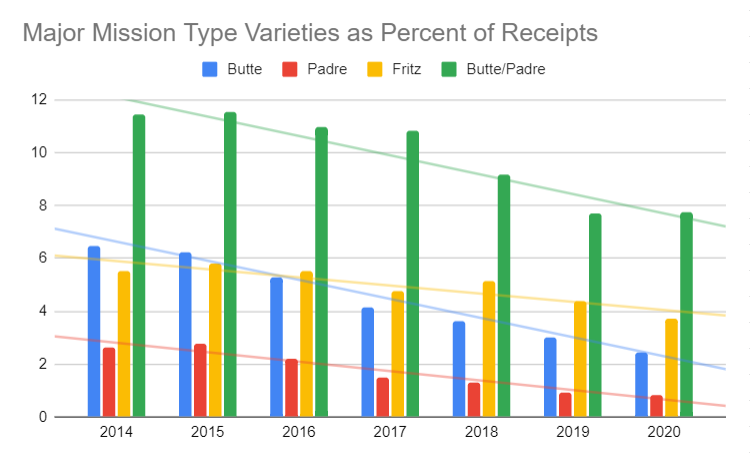
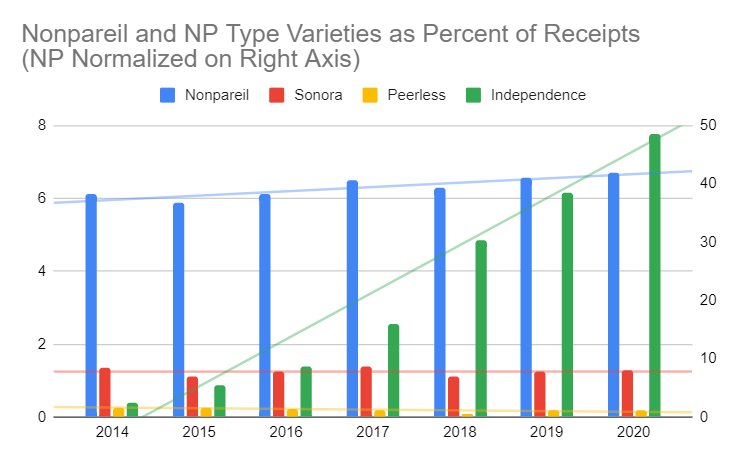
You can clearly see that Nonpareil Type and Mission Types are on differing paths. Mission Type falling from 11.52% of receipts in 2015 to 7.75% five years later. Inversely, Nonpareil Types have 40.22% of Receipts in 2014 to 51.14% in 2020. Looking in more detail, you'll notice that the primary driver in the Nonpareil Type is Independence going from .41% in 2014 to 7.77% in 2020 while Nonpareil itself saw more modest gains increasing from 38.2% to 41.88% over the same time period.
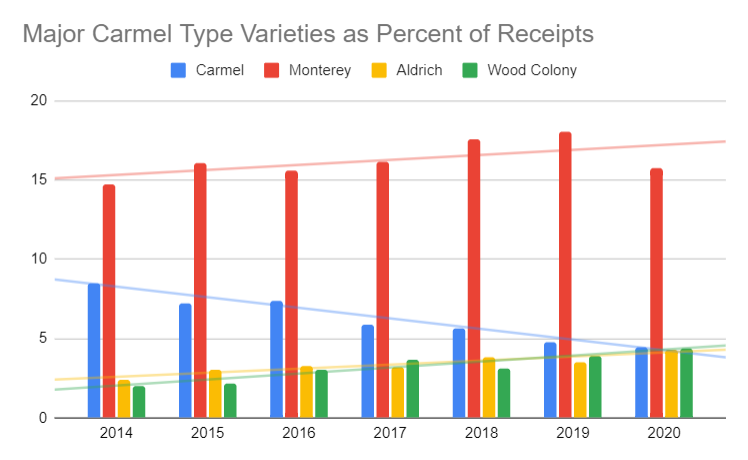
Carmel Type has been relatively stead over this tie frame, but this is not the case for the varieties that make up the type. the Carmel variety saw stead declines as a percentage of receipts since 2014 dropping from 8.46% in that year to 4.46% in 2020. The other major Carmel Type varieties of Aldrich, Monterey and Wood Colony helped buoy the category each seeing increases over that time period.
What Goes in Must Come Out
Whether it's simply old age or other external factors, orchards will ultimately need to be removed. The rate at which orchards are being removed on an annual basis is another important aspect to consider in looking at planting trends and crop make up. Unfortunately data regarding orchard removal is sparse and any detail specific to variety or variety type aren't readily available. We could make some inference based on trends we're seeing in crop make up, but it won't be the whole picture. As planting rates decline something to watch would the the rate at which acres increase. As the rate of increase declines, or should it ever turn negative, this would indicate an acceleration in orchard removal. This would be an indicator of possible supply issues.
Industry Perspective
Looking for a more in-depth understanding of market conditions facing the California almond industry? Then be sure to listen to this month’s episode of the NutNews podcast where CEO Bob Nunes joins to talk everything from the most recent Position Report, bloom conditions and crop outlook to intensifying drought conditions and water shortages. This wide-ranging conversation helps add context and detail to some of the most pressing topics relevant to California almonds and is a must listen.