Select Harvest Almond Update October 2020
What Do The Numbers Say?
The October Position Report published by the Almond Board of California continues to show strong commitment and shipment numbers. Total Shipments are up +25.31% August 1st through October 31st over the same period last year. In October the Industry moved 309,679,737 marking the first time shipping over 300 Million pounds in a single month. Both Export and Domestic markets set records for October shipments up +16.2% and +17.9% from a year ago. These are strong growth numbers, but are particularly encouraging in the mature US market where two months in a row growth has topped +17%. The +16.2% shipment growth in export markets is still quite strong, but is a significant cool down from the +49.1% and +39.1% figures we saw in August and September respectively.
New Commitments also slowed in October. We have been tracking this number as a measure of current buying interest and to project future demand. While we haven’t dipped below historical levels, we saw several months of above-average new commitments come to an end.
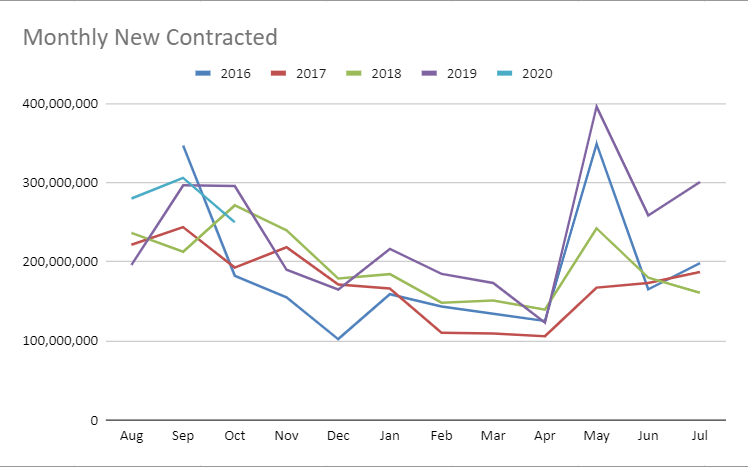
The natural question to ask is are we seeing a sustained slowing of growth, particularly in the export markets, and is it significant enough to rekindle over-supply concerns? Time will tell, but let’s look at a few other points of reference.
The Tale of Two Prices
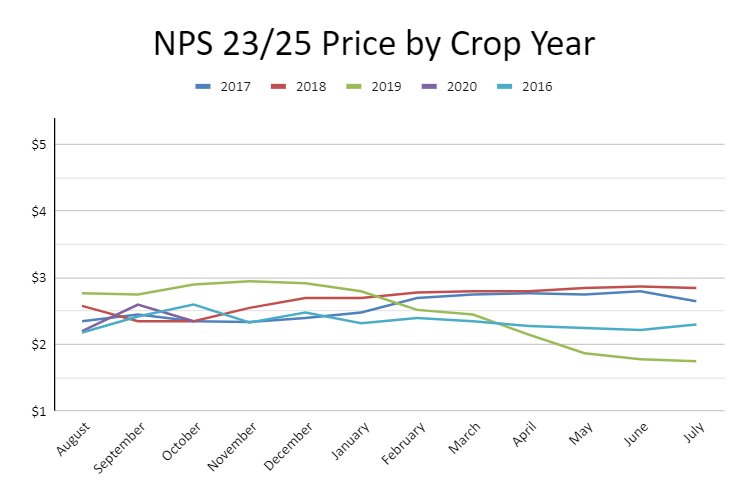
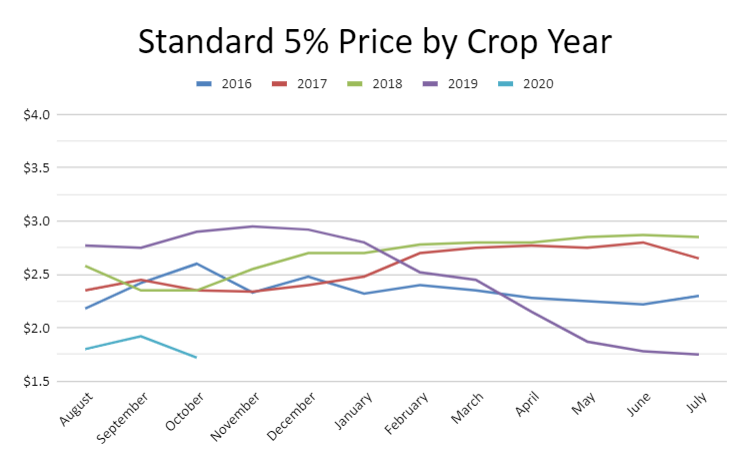
Here’s a look at pricing trends for NPS 23/25 and Standard 5%. You can see that both benchmarks fell below their normal price bands between May and July; however, NPS 23/25 since returned to roughly historical average where Standard 5% remains as much as -$0.80 off the recent three-year average. In an attempt to explain perhaps why this could be, one could argue that this year’s kernel size being skewed to smaller sizes puts pressure on the larger sizes. This is in fact true and logical; however it’s also worth asking how India may be influencing the price of NPS 23/25. The Sub-continent after all is up +110% on the crop year and +61.7% over October 2019. This market buys almost exclusively Nonpareil Inshell, so is it reasonable to suggest that India’s increased demand has pushed NPS prices upward disproportionately?
Digging Into India
Beginning in June, India has seen monthly YoY growth rates of +52.02%, +62.04%, +105.14%, +167.66% and +61.71%. As stated earlier, India is up +110% on aggregate through the first three months of the crop year. As the second largest market, and the largest export market, for California almonds, it is safe to say that India holds influence. While these growth numbers are especially impressive, it is reasonable to question the sustainability of these growth figures. We have suggested before that India is a particularly price sensitive market and if it is in fact influencing the price rebound of NPS, then you may conclude that what we’re actually seeing is a normalizing of India’s growth curve. While a sound conclusion, it may not actually be as price driven as you may think and a normalization of growth likely doesn’t mean India can’t continue to fuel the demand growth we’ve seen globally. Let’s explore.
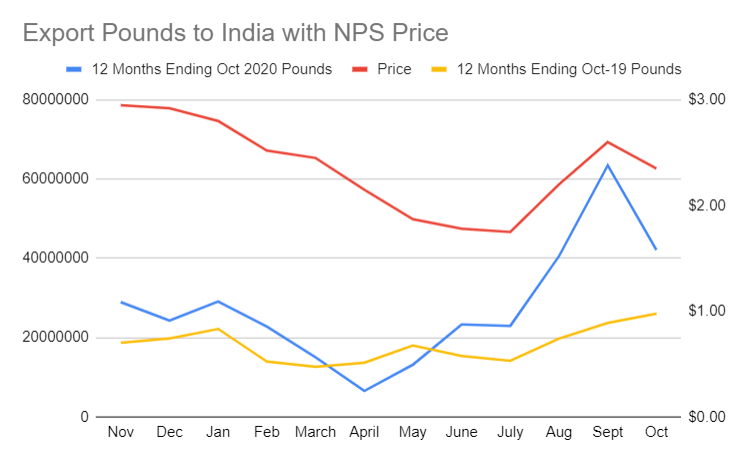
The Above chart shows export pounds to India for the previous 12 months (blue) compared to the year prior (yellow) with the last 12 months of prices (red) scaled to the right axis. The yellow line is there to show YoY growth and to put a few things into context. Between November 2019 and February 2020 India had paced +42% shipment growth. This was prior to the accelerated price declines we saw March thru July. As prices begin to slide in March, you see a slowing of growth where shipments actually fall below prior year levels. While this period of time was marked by high default rates within India as the market caught up to sinking prices, this time period also coincides with lockdown restrictions and logistical challenges associated with Covid-19. Since, we’ve seen India’s demand for almonds skyrocket and peak in September. This is where competing narratives come into play.
One could simply point to price and suggest it alone is the primary driver. However, as we pointed out, India had paced +42% growth Nov-Feb before prices declined. If you were to trend this growth rate out through today, India only catches up from the March-May shipment slump in September. Furthermore, averaging the last 12 months, India paces +52%. It could therefore be suggested that the spike in shipments we’ve seen in recent month’s was merely India catching up from a supply pinch and has actually been on a growth rate somewhere between 42-52% for the last 12 months. It could thus be suggested that we could seen sustained growth from India in this range even with NPS at a rebounded price level.
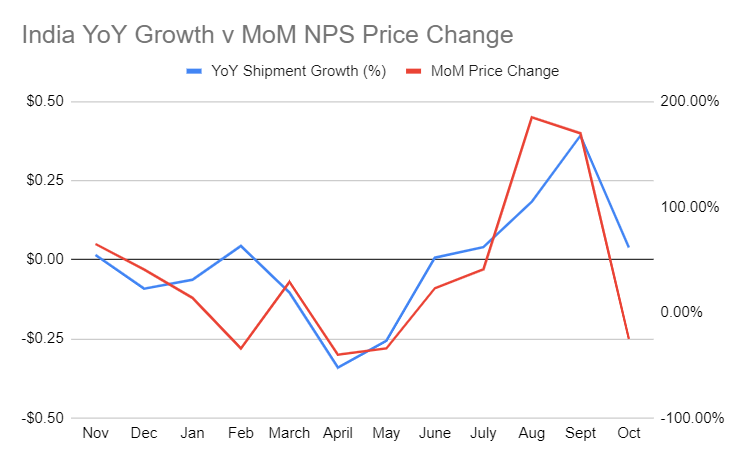
Take all of that for what you will, but we’ll leave India with one final bit of information. Here’s a graph exploring India’s monthly percentage growth over the prior 12-month period plotted with the month over month price change of NPS 23/25. Who’s influencing whom?
Wrapping Up
For the sake of brevity, we’ll leave it there. Suffice it to say that demand continues to see elevated levels in most major markets and India should continue to lead the way. There remains the expectation that we will see a large supply increase this year, but we are still several months out before we understand how accurate the forecasts were. That means handlers are likely going to continue to see pressure to move product, but with recent success in doing so, prices are unlikely to see any significant downward pressure. As always, we welcome your input and comments. Reach out to us at info@selectharvestusa.com and follow us on LinkedIn and Facebook.