Select Harvest Almond Market Update August 2020

What’s our Position
The Industry has been immersed in a buying frenzy. Consider these to stats from the Almond Board’s August Position Report just published: August shipments were up +30.68% YoY and commitments topped 1Billion pounds, up an incredible +88.09% YoY. Shipments were driven significantly by export markets, which set a new August shipment record surpassing the previous record set in 2017 by +25.5%. US domestic shipments were up +5.57%, itself a respectable growth rate for the large and mature market.
At this point YTD numbers are also MoM but, it must be said that India posted a growth number of 105%. This represents growth of well over +20 Million pounds. To put this in perspective, Spain, Western Europe’s largest importer, in August, touched just 15 Million pounds in total. Or look at it another way, India accounted for 31.9% of all export shipments in August. Effectively, 1 in every 3 export pound went to India. This is simply incredible.
None of that is to imply that other export markets weren’t themselves experiencing significant growth. Aforementioned Spain is up +12% in August. So too are other major Western European markets including Germany, Italy and the Netherlands up +42%, +70% and +60% respectively. As a region, Western Europe is up +29% representing +10.6Million pounds in growth. Direct shipments into China, as well as commonly associated pass-through markets in Asia, will be an interesting growth channel to watch as August growth in the region were also strong.
The domestic market would be easy to overlook with the large shipment growth in export markets. But as the largest market for California Almonds, the +5.57% growth figure is an important one, especially considering the relative maturity of the market compared to many of the export markets seeing growth. The US market is nowhere near as price sensitive as markets like India either. That isn’t to say that the US will bear any price, it won’t. And it’s true that historically we’ve seen new product R&D contract when prices reach historical highs, but that takes time to correct. To suggest that US growth is simply price driven probably falls short of the mark. Which begs the question: What IS going on?
Into the Weeds
Fair warning, we’re going to dive a little deeper than we usually do. But we’ve been seeing some interesting trends over the last several months and wanted to take the time to share them with you in context with the most recent position report. What we want to explore next boils down to a few basic and interconnected questions. Have we entered a new period of demand growth? How did concerns of over supply and Covid drive price declines early in the year? And finally, do answers to either question give us any confidence moving forward?
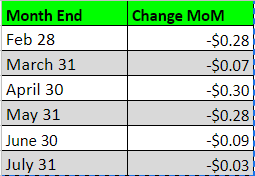
Let’s step back and first examine price trends to give us some perspective in the conversation ahead. Here is price movement on NPS 23/25 since the end of February. The table compares end of the month closing price to the previous month.
While not mutually exclusive, we’d suggest two major influencers on price over this time period. The most pervasively discussed in the industry is the supply increase expected going into harvest. Less discussed is the impacts of Covid. So, let’s review the timing of a few key events to put things in perspective:
Bloom – By the end of February it is already apparent that bloom saw ideal conditions up and down the valley. The talk of a larger crop to come has already begun, but size is still very unclear.
Covid Hits – By mid-March the US has begun imposing certain economic restrictions, though food businesses are allowed to remain open. Globally there is a patchwork of lockdowns and restrictions whose impacts will begin trickling through supply chains
Forecasts – Subjective Forecast is published beginning of May and the Objective Forecast follows to start July. Both project a 3Billion pound crop signaling a hefty supply increase.
Before we dissect the timing of these events and how they may have influenced markets, let’s consider a few other pieces of information.
Shipment Trends
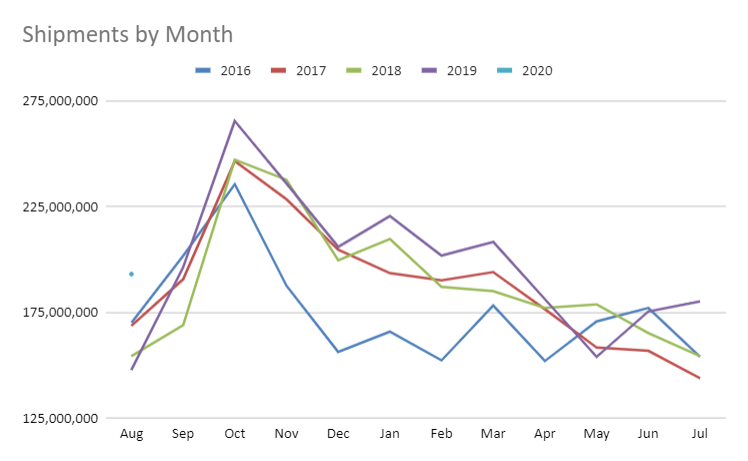
Aug 2019 Through March 2020, shipments had averaged +5.95% MoM. In April, this trendline reversed and by May shipments were off -13.9% MoM. This directly aligns with the tightest restrictions of Covid-19 and the biggest disruptions to global supply chains. As we saw in the first table, it also coincides with back to back large-scale price corrections in April and May (-$0.28 and -$0.30 respectively).
Since May, some very interesting things show up in our graph. In June shipments rebounded to their pre-March trend lines and then in July, shipments had their best MoM performance on the year up +16.83%. If you recall all the way to the start of this report, shipments continued to climb topping +30% MoM in August as well.
Monthly contracted pounds have also spiked in June and July. This isn’t a metric we’ve talked about, but is a way to measure the pace of buying by examining how much future business was contracted during a given month. The chart below gives some historical context. One note, May is the first point in which new crop sales are reported and thus show a corresponding bump. Therefore, use May as an indicator of interest in new crop whether than a true measure of business conducted in May.
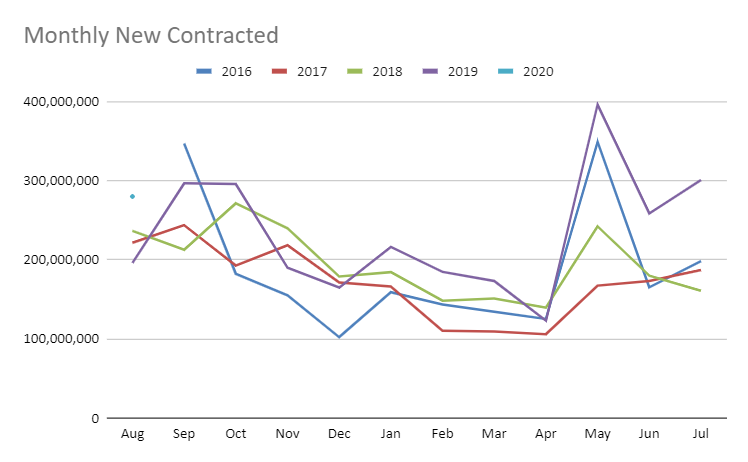
With that in mind, we can see that May commitments outpace any other crop year since these records began in 2016. May aside, June and July monthly new contracts outpaced last year by 232 million pounds up +55.1% over June and July 2019 which themselves were also up +17.2% from 2018. Current August numbers continue this trend and are up +47.8% MoM. During this time period, new contracts are outpacing the previous year by +58.6% This shouldn’t be a surprise when the position report is showing +88% in commitments - these numbers don’t happen overnight. But this should highlight how unprecedented the buying really has been, and it’s been happening for a while now.
A New Narrative
So now, let’s take a different look at our timeline and try and answer some of our original questions:
Feb 2020, beautiful bloom has already signaled a large supply increase on the horizon. Prices soften, but stabilize. March is only off -$0.07
April 2020 Pandemic restrictions are in full swing. Supply chain issues and turmoil are the drivers of price declines. Restrictions and uncertainty persist.
May 2020Subjective Forecast is published. Markets have already been in correction though and a larger supply may have already been factored in. Declines see in May could have already been baked in with Covid.
June 2020 pandemic restrictions have eased in many places and others have adjusted to new operating norms and have rebuilt supply chains. Buyers are pouring into the market to take advantage of newly lower prices. Demand for almonds skyrockets as health becomes #1 and consumers globally are eating in more frequently fueling demand for both indulgent snacks and healthy nutrition, which Almonds play a role in both.
By July price sensitive markets are in full force and globally major markets have responded to both demand and low prices accordingly. Prices have come off their floor and are likely to rise as handlers begin to recognize that the price declines seen in April and May were pandemic fueled, not necessarily supply fueled. Fear of being over supplied will likely wane and handlers will begin searching for a ceiling. If March’s stabilization after bloom is an indication, there could be plenty of price upside to come.
If you want more proof of this sentiment, there are plenty of reasons to be optimistic on demand. Our next section provides a few be primarily looking at the domestic retail landscape, but there are parallels globally. The short of it is, strong demand is here to stay.
The Sphere of Influence Driving Demand
This shouldn’t surprise anyone living in the USA: Grocery Retailers are having their day. We’ve yet to come across a major grocery retailer whose summer numbers are down. As an example, Costco just released their August numbers and reported same store sales growth of +14.3% in august after posting 15.7% the month before. Retailers we work with report similar, if not more robust numbers. The trend of less frequent store visits but larger purchases has held true and has fueled growth and large portions of the US work force continue to work from home.
Online grocer delivery has also exploded. Consider Instacart whose estimated 57% market share for home delivered groceries has driven a 29% growth rate since the beginning of the year. They’ve also partnered with Walmart and 7-11 stores to broaden their market dominance. Many other retailers have fallen suit building their own proprietary delivery services or partnering with new competitors to Instacart like the restaurant delivery service DoorDash. Walmart launched a membership program for it’s online delivery program and also expanded it’s third party market place early in the year. All that is to say that shoppers are indeed turning to the web to fulfill their shopping needs and growth in these categories come on top of in-store growth. Consider Costco again who reported online sales growth of +101.6% in august and +75.3% in July.
Combined these retail trends also highlight a change in consumer behavior. Sales of single-serve items are being replaced by larger ‘bulk’ packages. The reduction of on-the-go consumption as schools remain closed and workers stay home have consumers looking for both cost savings and the ‘convenience’ of a more ‘shareable’ pack size while at home.
To put this all in context one must consider the acceleration of health-conscious consumption trends. We’ve belabored this topic is past updates, but the reality is consumers were already making the pivot to more health-conscious consumption. In the midst of a pandemic, consumers have only made this adjustment quicker. Pair that with at-home consumption and ease of procurement, it’s no wonder we’re seeing significant movement in almond-based grocery items.
Internationally there is a similar narrative. People are at home more and particularly more conscious of what they are consuming. Almonds have a globally recognized position as a food with broad healthy consumption outcomes. Paired with the dual drivers of a pandemic and better accessibility due to price declines, it’s no wonder that almonds are having their day. And this isn’t going to go away immediately. Price have begun to rebound and that’s likely to continue. The demand we are seeing can no longer be equated as a supply chain rebound or a few buyers taking advantage of a price trough. The demand is real and sustained. And will be the narrative for some time to come.