July 2025 Almond Market Report
The end of July marked the end of the crop year for California almonds. The July Position Report shows that during the crop year, California growers harvested just over 2.7 billion pounds of almonds, up +10.9% YoY. Factoring in the carry forward, total supply actually decreased -1.1%. Handlers shipped over 2.6 billion pounds, off just -1.7% YoY. Computed inventory at the end of July totaled just under 515 million pounds, +1.7% YoY.
During July, handlers shipped over 197 million pounds of almonds, up +9.9% YoY. Export shipments grew +16.4% over last July, while domestic shipments shrank -5.6%. On the crop year, export shipments were relatively flat, growing just 0.57%. Domestic shipments were off -7.8% and accounted for the fewest pounds since the 2015/16 crop year.
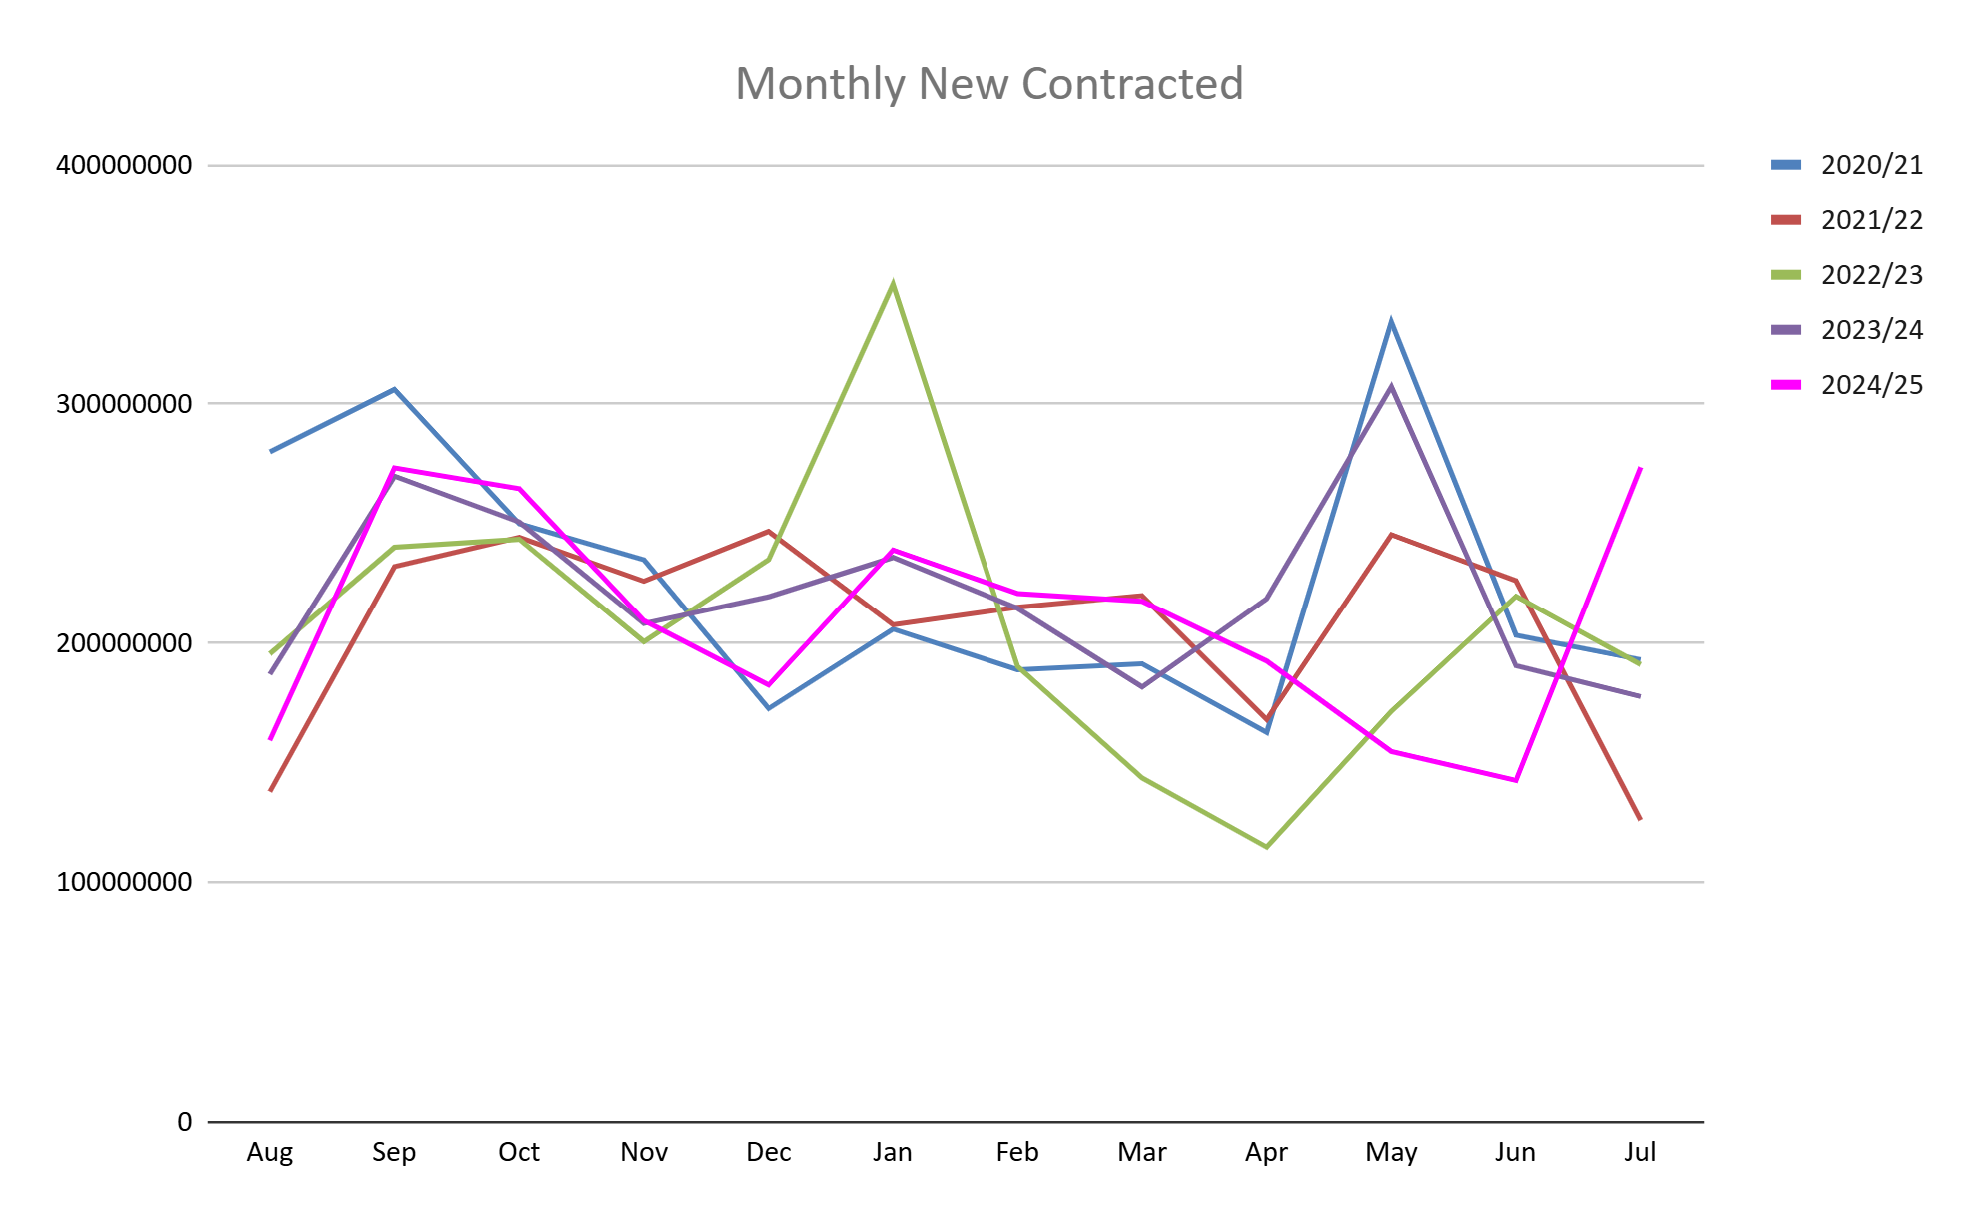
Looking ahead, handlers have -9.3% fewer commitments on the books for the current crop than they did a year ago and -24.8% fewer commitments for new crop than at this time last year. While overall commitment levels may be down YoY, the pace of buying in July was far above average with over 273 million pounds sold during July. This represents a significant increase in the pace of buying and a very clear anomaly for July.
Market Trends
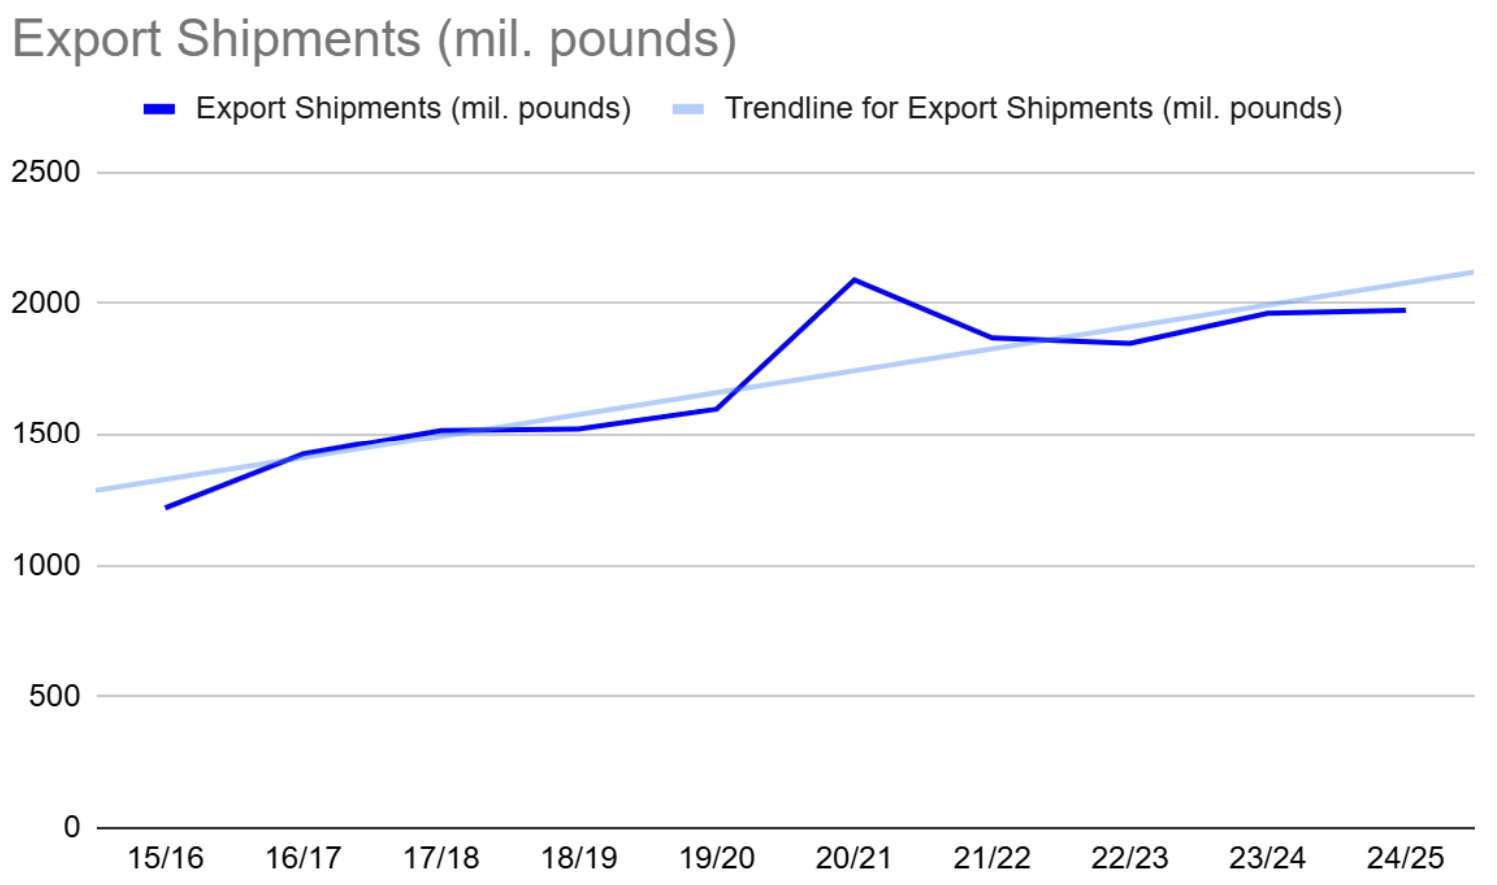
The end of a crop year marks a good time to reflect on broader changes to the market. The 24/25 crop year saw a significant retraction within the domestic market with shipments falling -7.79% YoY. Handlers shipped fewer almonds to domestic destinations than in any year since 2015/16. Declines domestically were partially offset by export markets, which grew at a modest +0.57%. The growth in export markets has been relatively consistent year after year with the exception of a large spike in volume and subsequent retraction during the oversupply year of 20/21 and a subsequent smaller year in 21/22. The trendline in the chart below illustrates this long term growth and suggests that we may see this trend continue in the year ahead.
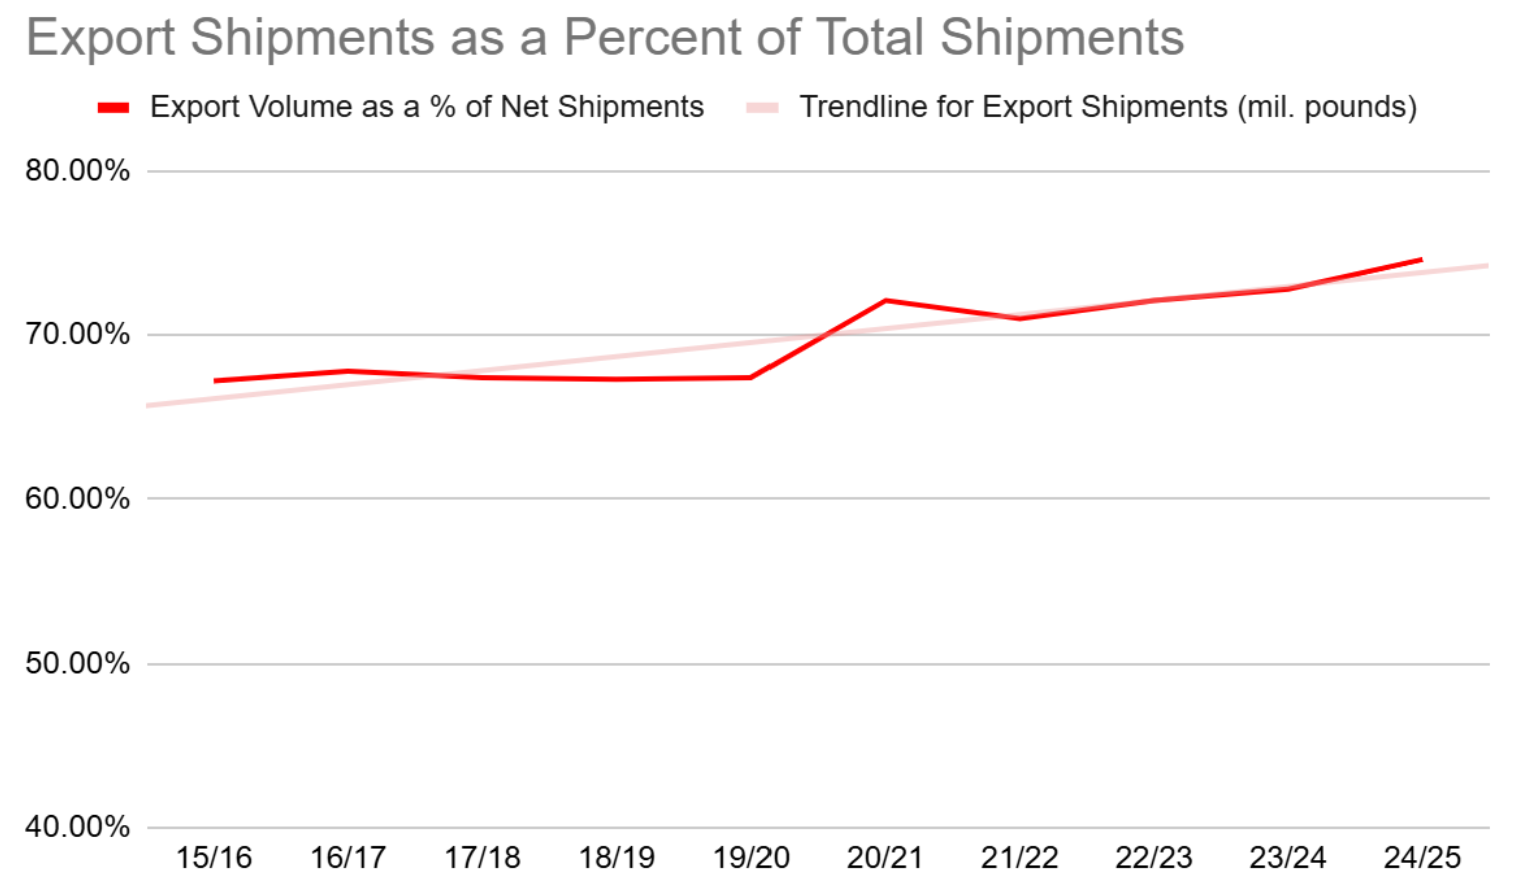
Prior to the oversupply year of 20/21, export markets very consistently accounted for about 67.5% of all shipment volume. In that over supply year we saw that percentage jump to 72%. Export shipments haven’t accounted for less than 71% of all shipments since and grew to 74.6% last year. The change in market mix away from domestic to export markets has been gradual, but shows the strength in global demand for California almonds.
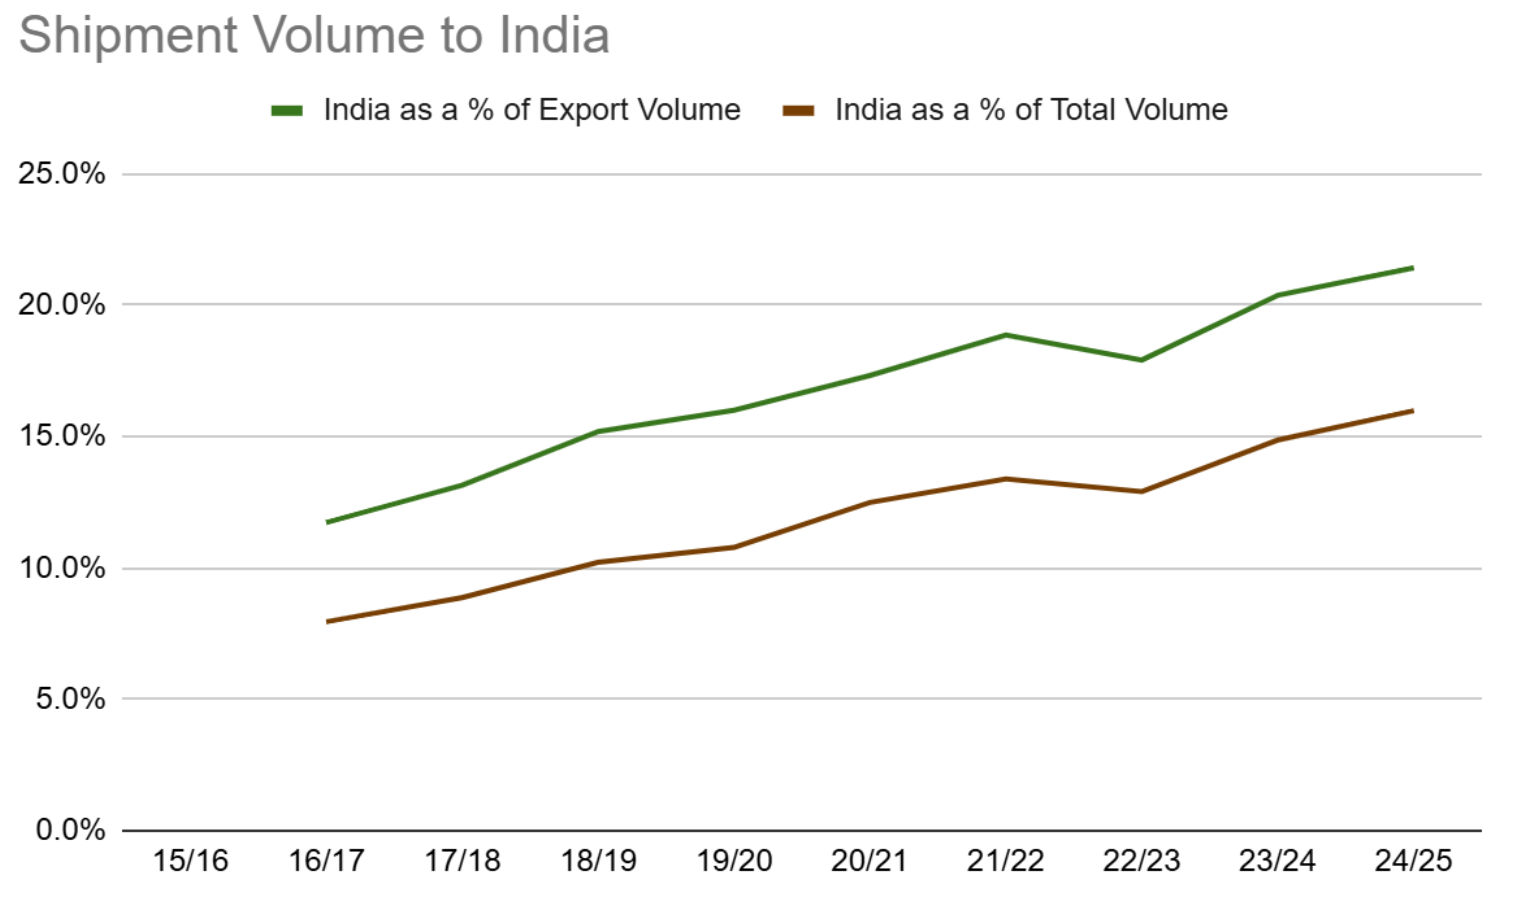
During this time, India has been the primary driver of growth. Consider that in the 2017/18 crop year India still trailed Spain as the largest importer of California almonds, each receiving about 200 million pounds. During the crop year that just ended, India imported more than twice that amount bringing in 423 million. The volume increases are impressive enough, but India now accounts for 16% of all shipments leaving California almond handlers’ facilities. During the 17/18 crop year India accounted for just 8.9% of all shipments.
India’s rapid growth and importance to almond markets can also be illustrated by India’s outsized growth compared to other export markets. During the 17/18 crop year, India accounted for 11.7% of all export volume. In the year that just ended, India’s share of export shipments grew to 21.4%. This helps contextualize the general strength that is observed in export markets and highlights that the true strength has been India.
Are Midsized Markets Maturing?
As we observed the growth and shifting within export markets after the 20/21 oversupply crop year where virtually every market grew, we wondered if the acceleration of shipment to export markets was being driven by the emergence and maturation of mid-tier markets. While certain markets like Vietnam which saw a +135% growth between the 19/20 crop year and the 20/21 crop year have continued to grow, we didn’t see broad evidence that these emerging mid-tier markets that experienced growth during the oversupply year have been able to sustain growth consistently over time, nor have we observed small markets collectively gaining momentum. Instead what we found is that during the 20/21 oversupply year the top 10 export markets increased from accounting for 47.4% of all export shipments to 50.7%. In the most recent year, the top 10 markets accounted for 52.6%. One might therefore conclude that handlers have had more success in cultivating the largest markets for continued growth; however, if you remove India, the remaining nine export markets have remained relatively consistent during that time period, again, highlighting the outsized impact that India has had on export market growth.
Year End Market Review
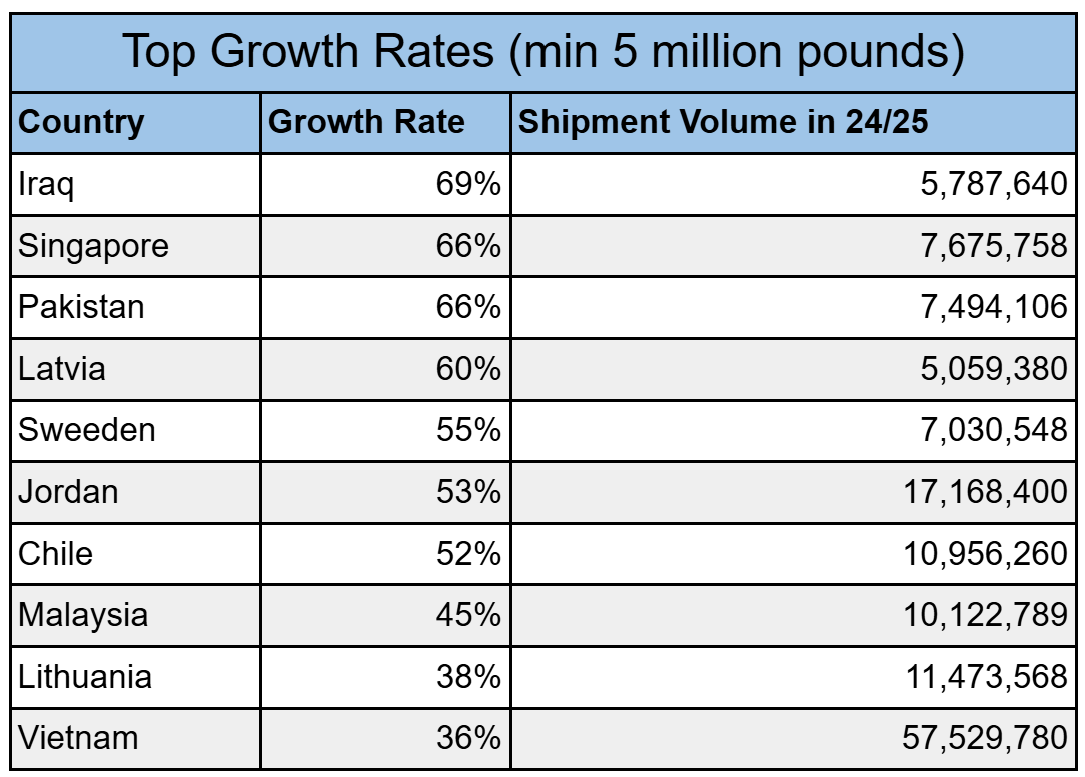
India would top the growth chart if we were benchmarking volume growth, not percentage. Nevertheless, only markets that imported at least 5 million pounds are represented on the list, meaning that some of these growth markets saw sizable increases in import volume last year. Vietnam, Singapore and Malaysia were all markets we have highlighted this year and are likely seeing increased growth rates as Chinese buyers look for other value-added sources as the China-USA trade environment has made buying from the US less cost effective. Others on the list represent continued opportunities headed into the new crop year.
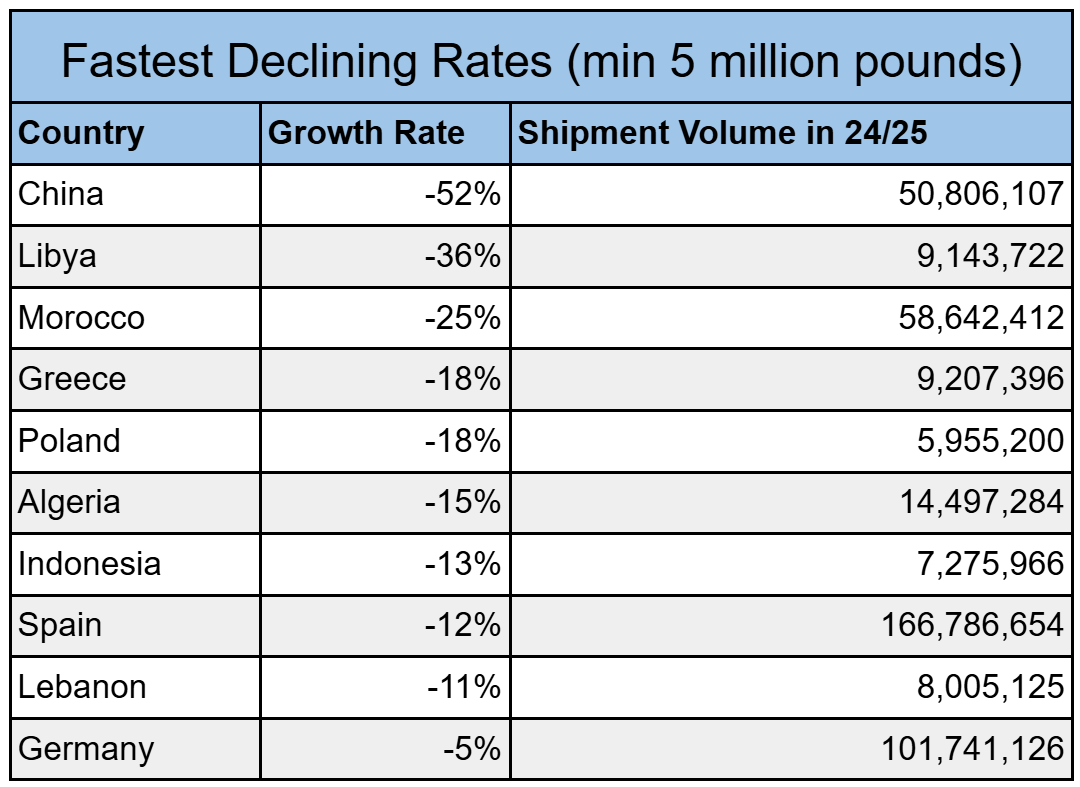
China's decline should come to no surprise to followers of the California almond industry. Even casual observers understand that the trade situation between the US and China has made businesses reconsider their supply chains. Trading partners in South East Asia that have value-added capacity and have enjoyed a relatively favorable trade environment have offered Chinese companies alternatives in redesigning their supply chains. When taken as a whole, China and markets in South East Asia, including Indonesia, Malaysia, Philippines, Singapore, Thailand and Vietnam, imported over 151 million pounds in the current crop year. A year ago, this same group imported 186 million pounds. While this is still a year over year decline, the rate of decline is relatively smaller at -18.8% compared to the -52% decline in volume that went directly to China. As long as trade tensions continue between the US and China, expect a continued shift away from direct imports to these value-added markets as long as local capacity can accommodate.
Spain is another large market experiencing sizable decline. Nearby production increases in Portugal have likely driven much of this decline as local sources will always have an advantage when factoring in transportation costs.
Morocco has seen some wild swings between excessive growth and significant declines. It continues to have a particularly high per-capita consumption rate and will continue to have significant demand for almonds, but may continue to show volatility month to month.
Market Summary
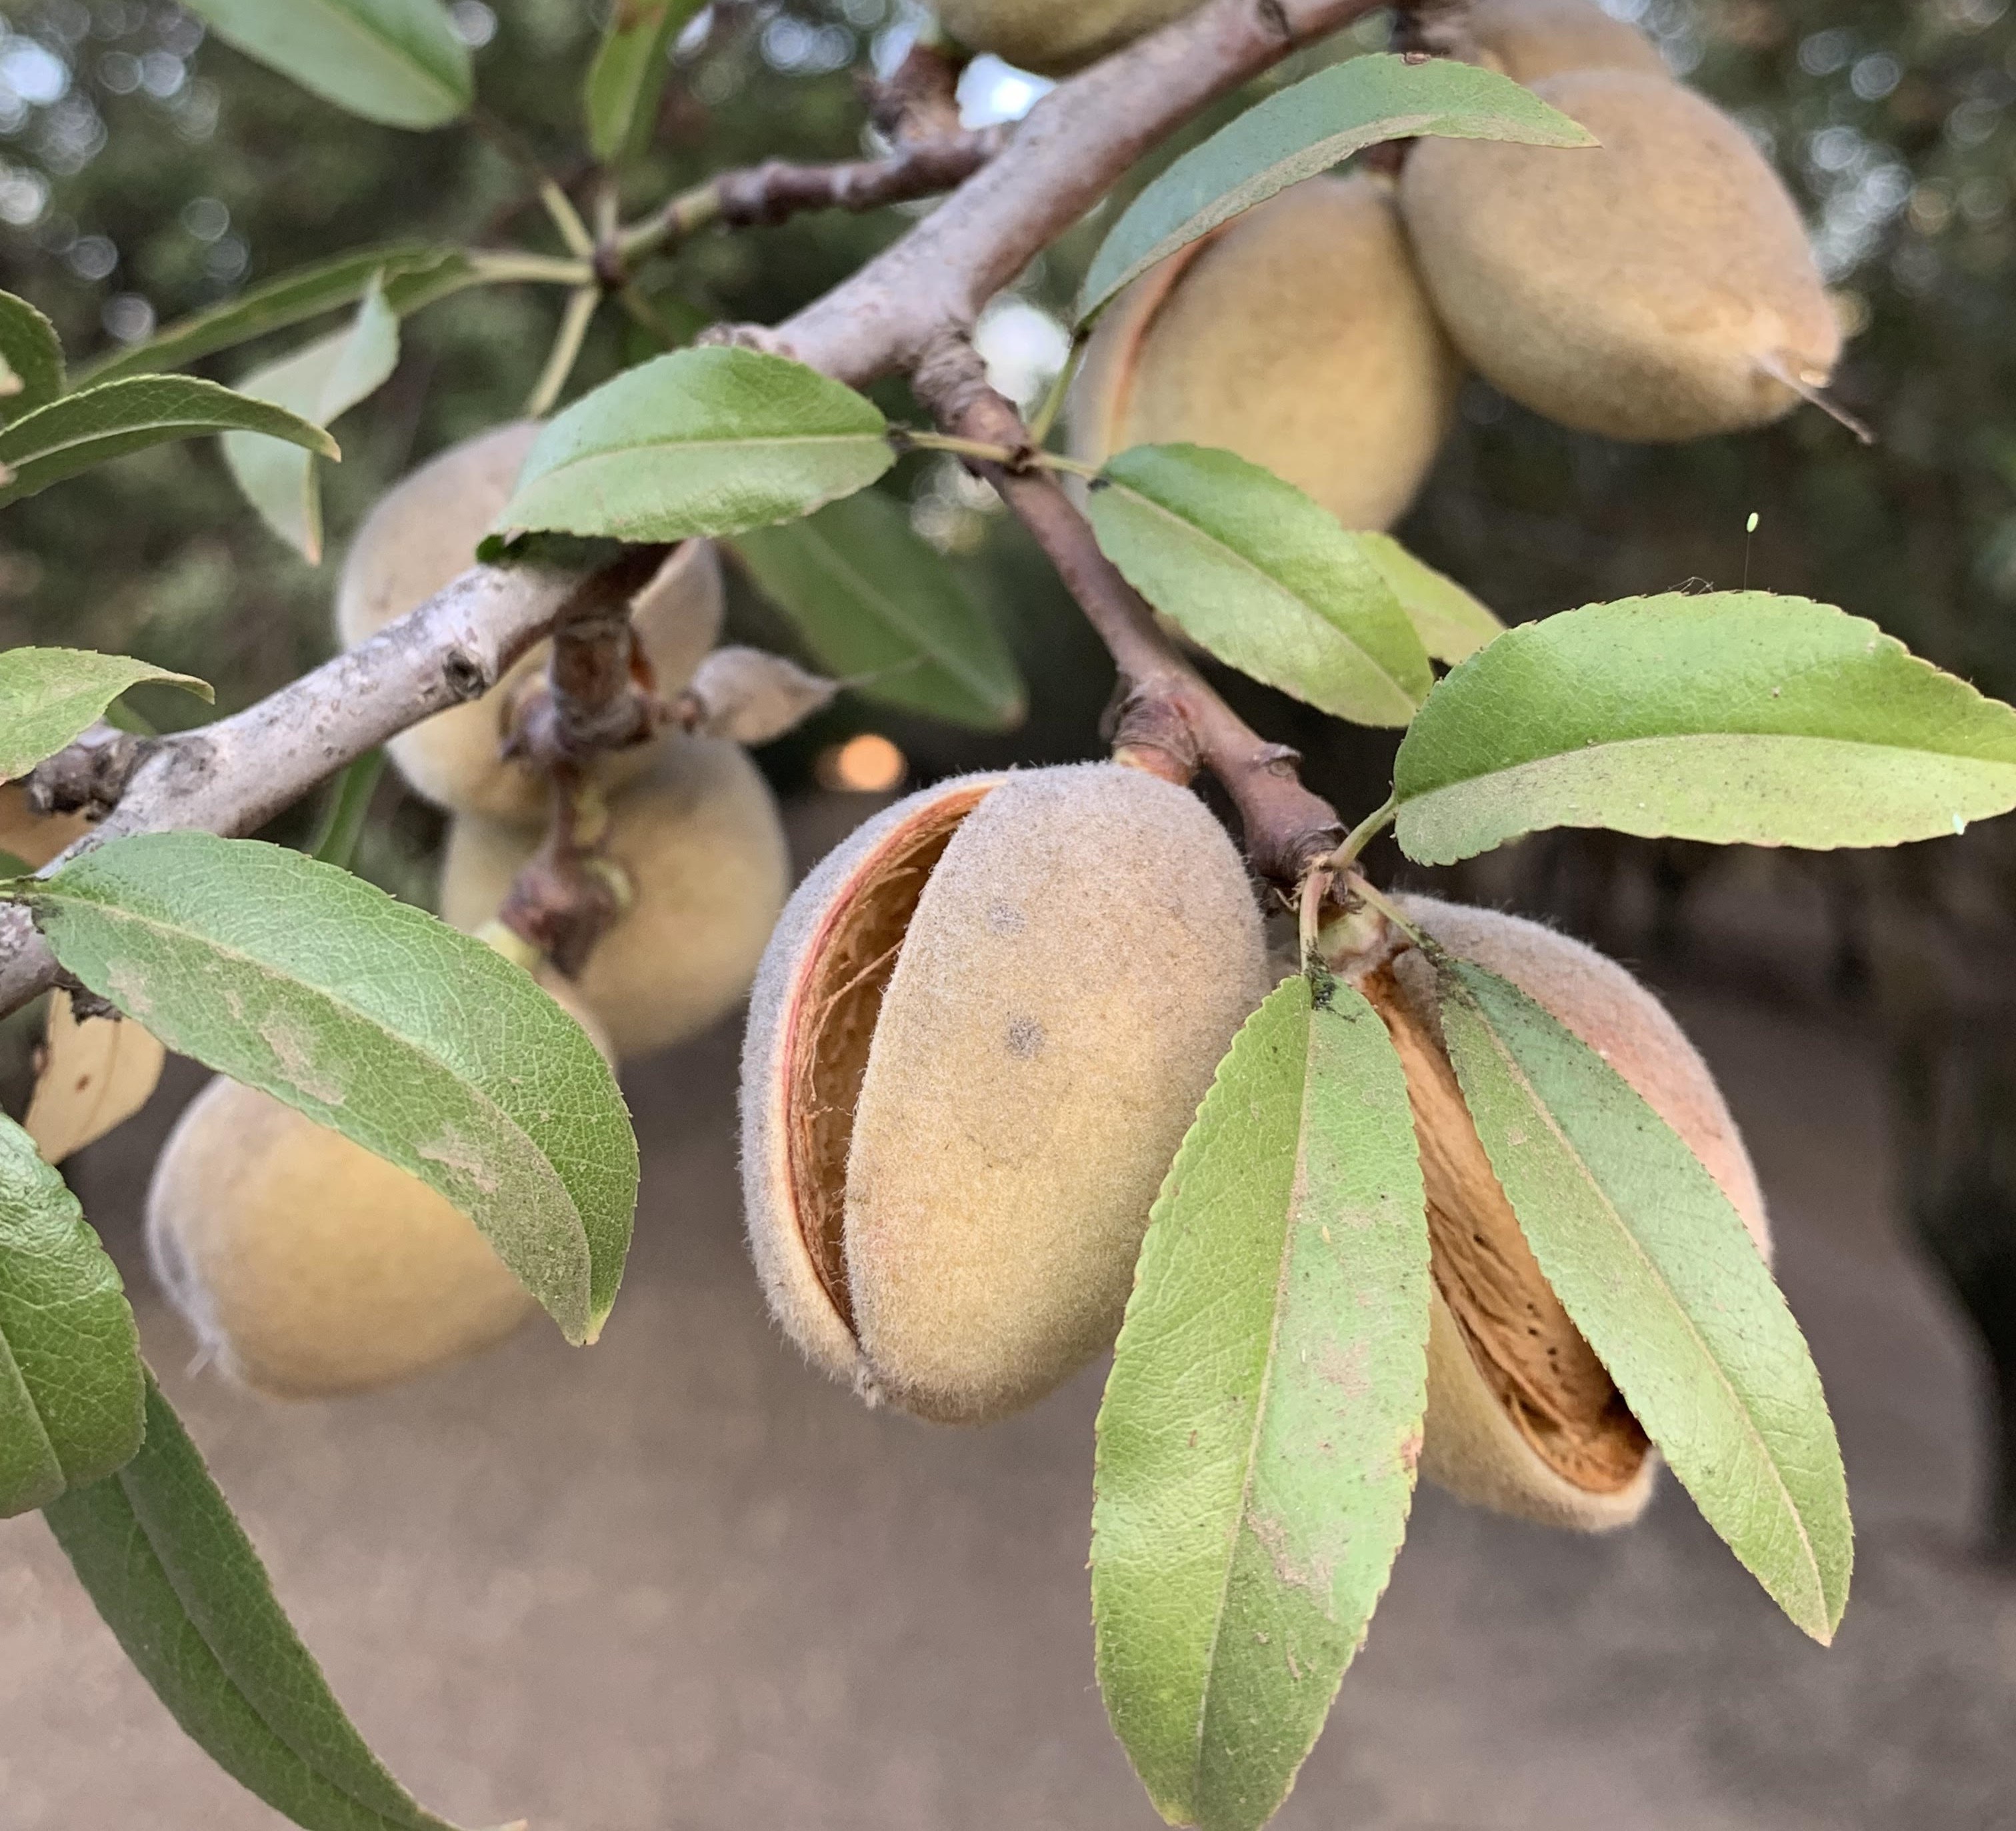
With another crop year in the books, everyone is looking towards harvest. Growers have been active in their orchards as many have begun the first stages of harvest with the earliest varieties. The weather has been relatively mild by California standards, which reduced some of the stress on the trees and provided near-perfect conditions for almonds growth.
With the Objective Forecast predicting a 3.0 billion pound harvest and the carry forward sitting at 515 million, July began with an expectation that this year’s harvest will provide some additional volume from California handlers in the coming crop year. Prices had soften ahead of the Objective Forecast about $0.20 and declines accelerated another $0.50+ as July went on. But as August grew near, much of those declines came back with prices up +$0.45 since their lowest point in mid-July. The question at hand is why did prices rebound so quickly?
Demand presents an interesting variable in this market. Handlers have long been targeting a 500-550 million pound carry forward and understood that any acceleration in shipment volume could stress their ability to cover contracts through the transition with on-hand inventories. This likely contributed to price increases seen in the spring and summer. But as prices increased, shipment volumes remained robust. Forward contracts however slowed, with both handlers being reluctant to over-extend their inventory and buyers being cautious ahead of the forecast. With a larger than expected Objective Forecast, supply was no longer constrained and prices fell.
Buyers took advantage and went on quite a buying spree putting over 273 million pounds under contact during July. This created the conditions for prices to rebound as Handlers were able to get some needed business on the books while also confirming the significant pent up demand. This has Handlers questioning whether the expectation of a larger crop that the Objective Forecast set is sufficient enough to cause real supply side concern. Consider that the Carry Forward represents a stock to use ratio of 19.5%. This is inline with a healthy and balanced market. If there is an expectation of pent up demand, there may be belief that an extra 200 million pounds may marketable without discounting.
This of course assumes faith in the Objective Forecast. Widespread skepticism on the 3.0 billion pound figure has taken root amongst growers and handlers as harvest begins. It will be some time before there is a real grasp on the likely size of the harvest, but the fact remains that there is still quite a bit of uncertainty as to the eventual size of the crop. If that takes some handlers off the market and buyers are left needing short term volume, there could yet be additional price recovery in August.
The question now is whether buyers will continue to look to fill their outstanding needs and how willing handlers are to take future contracts with much of harvest still unknown and shipment levels continuing to be robust. With buyers looking ahead to the holiday seasons of Diwali and Chinese New Years, there are significant volume needs yet to be fulfilled. Furthermore, few alternatives outside of California exist with inventories from Australia effectively depleted at this time of year. We will be looking for signals from our growers and crop receipts as to what the eventual yield may be as expectations regarding crop size are the biggest variable currently in play.