April 2024 Almond Market Report

Turning the calendar on April brings us ¾ of the way through the crop year. This is also the time when the industry can reflect on the trends that have materialized throughout the year and begin to look towards the future as both April’s Position Report and the annual Subjective Forecast get released just days apart. We’ll look at both of these reports and try to tease out what they tell us about the state of the California Almond Industry.
April’s Position Report
California handlers shipped nearly 241.5 million pounds of almonds in April. This is less than -8.5 million pounds below the record for April set in the 20/21 crop year. It should be noted that the 20/21 crop year was covid impacted and shipment volume had diverged from historical patterns. In recent months we had been postulating that shipment trends were returning to pre-covid demand cycle, and if that truly was the expectation, than the 241 million pound figure seen in April is quite remarkable. In fact under the pretenses of a return to normalization, we’d have expected a shipment figure closer to what we saw a year ago in April. As such, the +22.4% year over year lift observed in April should be understood as a significant indicator of strong demand. What is truly remarkable it that through 9 months of the crop year, the industry has shipped over 200 million pounds each and every one of those months. Only the record shipment year of 20/21 saw more months of 200+ pound shipments within a full crop year (10). These were not consecutive and there are still three months left to match or beat this record. This poses an interesting question about demand cycles however. Whether the industry is still adjusting as it returns to historical cycles, or if perhaps a new and different buying pattern is emerging is very much up for debate.
In either case, Domestic shipments rose +14.1% YoY and now pace +0.6% on the crop year. Export shipments were up +25.8% YoY in April and now pace +5.61% on the crop year. On net, the industry has shipped +4.24% more than this time a year ago.
Export Markets
China is off -25% on net for the crop year. The largest gap is within inshell products, with shipments off -28 million pounds YoY. Kernel shipments are off a comparatively small -3.7 million pounds. The political climate between the US and China doesn’t offer much optimism as the US just levied additional tariffs on Chinese goods with the Chinese government promising retaliation. Whether this directly impacts almonds is yet to be seen, but generally cooperation is a better climate for advancing the exchange of goods.
India has grown at a +18% clip thus far on the crop year. In April, India imported over 32 million pounds, adding +12 million more pounds than a year ago. On the year, India has imported over 321 million pounds of almonds. By itself, India has accounted for over 15% of all almond shipped by California handlers. The only real comparison in terms of volume is the US domestic market which leads all markets having purchased 547 million pounds on the year. Whatever the comparison, an +18% growth rate on that volume is quite remarkable and speaks to the general demand for California Almonds.
Elsewhere in Asia, South Korea and Vietnam continue to be bright spots. South Korea has imported over +9 million pounds more thus far through the crop year and is growing at a rate of +23%. Vietnam has grown 82% and has added nearly +14 million pounds so far this year over last.
Western Europe as a whole continues to show demand growth. The region is up +8% on the year. Spain and Germany as the two largest markets in Europe are up +1% and +2% respectively. Growth for the region is primarily being driven by the Netherlands, which has grown thus far at a +30% rate. It has imported just 3 million pounds less than Germany and may yet overtake Germany as the second largest market in Europe. Italy is up +3% on the year and the UK has rebounded from a year ago and is up +33%.
The UAE as the Middle East’s largest market is up +9% on the crop year and has surpassed 119 million pounds imported on the year. Turkey has imported over 71 million pounds and is growing at a +15% rate. The region as a whole however is only growing at a +4% rate. Markets like Saudi Arabia that had seen growth a year ago have failed to maintain the volume.
Immediate Supply and Demand
The industry currently has 1110.4 million pounds on hand to ship through the end of the year (Computed Inventory).We’ve noted previously that this figure should be further reduced as the Position Report estimates a 2% loss/rejects figure but current crop has seen a figure over 4%. Taking an additional -2% from available inventory, the figure is reduced to 1088 million pounds on the supply side.
On the demand side, we could project the +4.24% net growth rate forward and estimate the industry to ship another 593 million pounds through the last quarter of the crop year. Historically, these are the lightest shipment months of the year, but on the other hand, shipments have consistently been over 200 million pounds per month and have been exceeding historical trends. Maintaining modest growth seems quite plausible.
It should also be noted that new monthly commitments in April were quite strong for this time of year. The monthly buying trend can get masked by the overall commitment figure presented in the Position Report which shows committed inventory effectively flat YoY at -2.12%. But let’s compare that to a month ago when commitments lagged -11% YoY. When viewed over time and compared to pre-covid cycles, the pace of monthly buying in April really stands out.
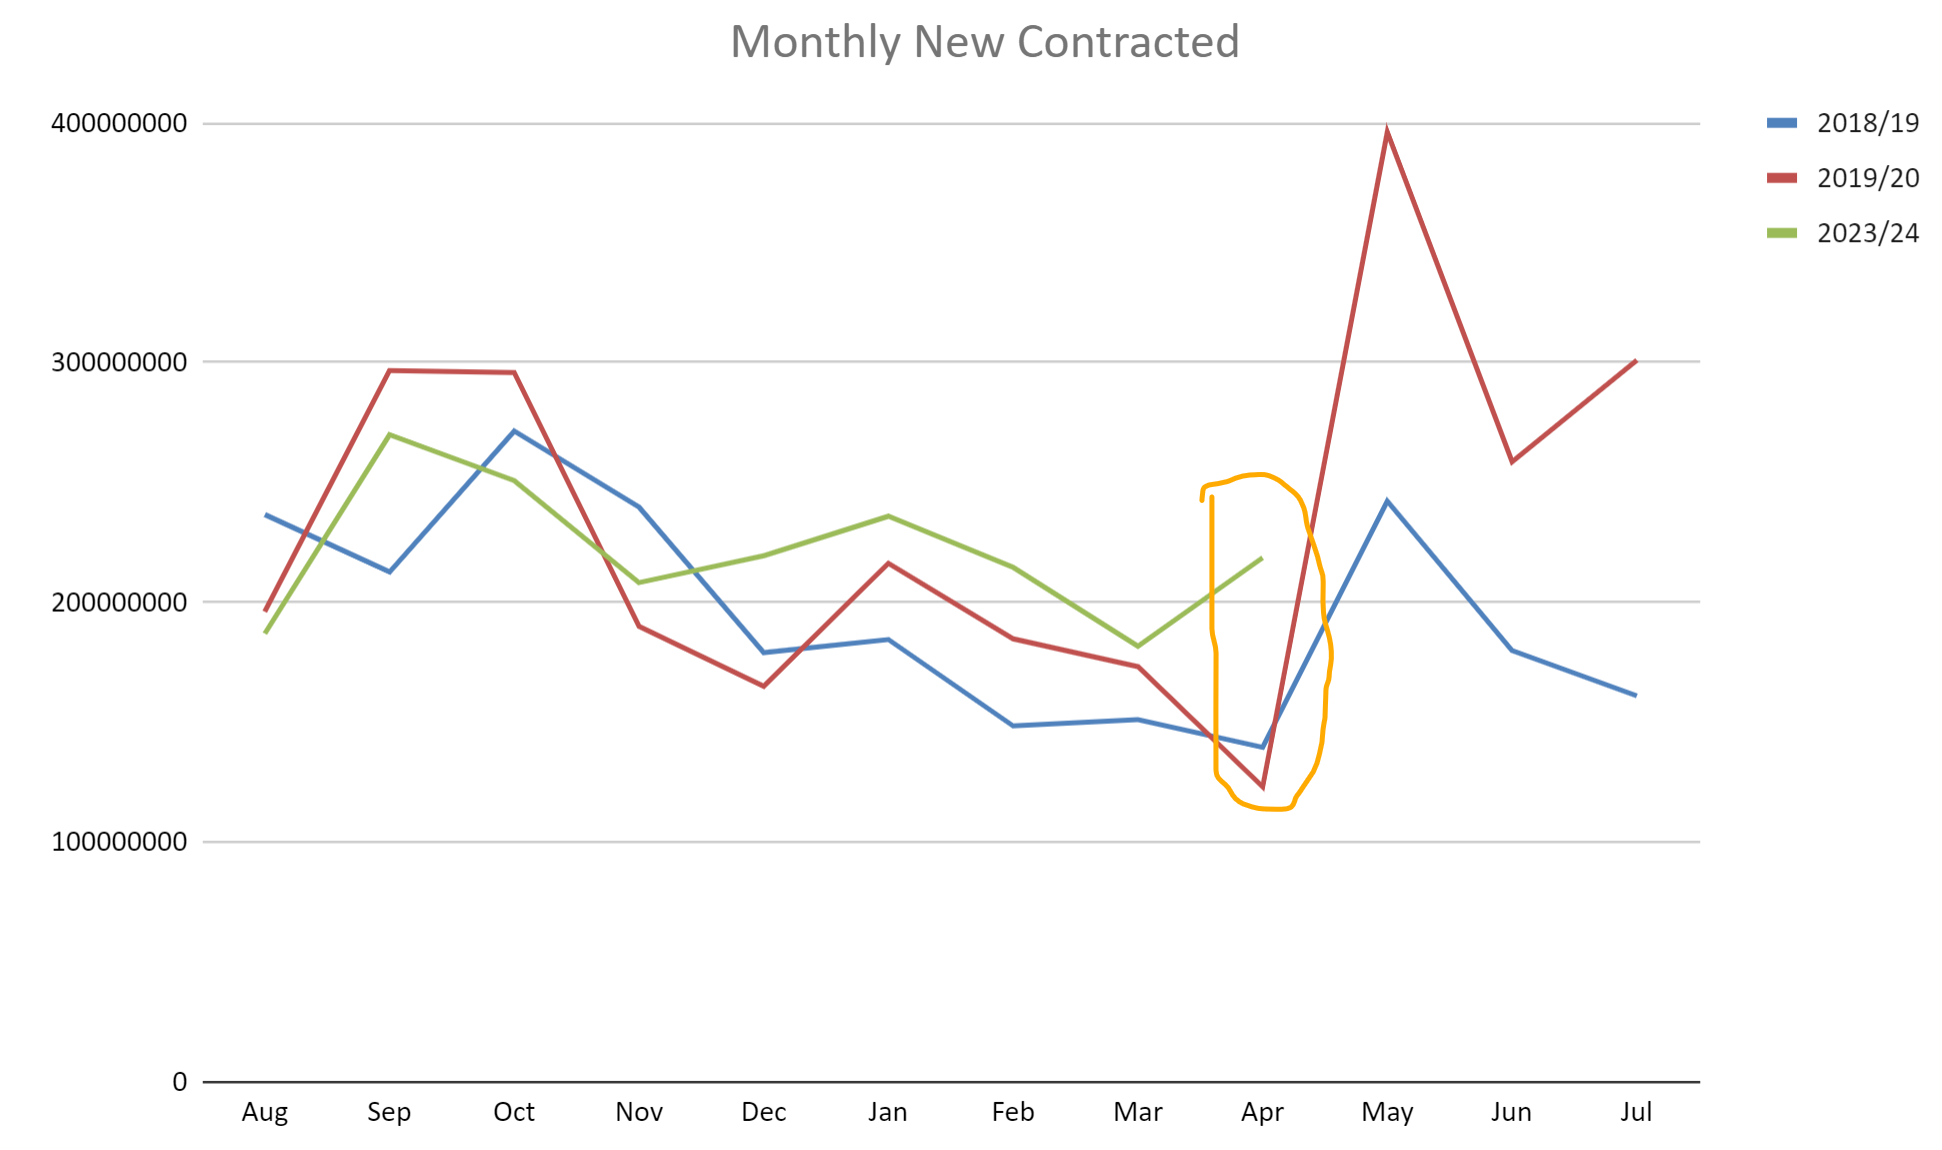
Note that the spikes that occur in May are a reflection of new crop year commitments beginning to be included, thus May should not be read as having an extremely active buying pace, simply that it aggregates all new crop commitments that had occurred prior that weren’t previously included. But that still leaves us with the question of what is/was going on with the increase in current crop commitments in April?
One way to interpret this requires that we combine the supply and demand projections that we previously calculated. With a supply of 1088 million pounds and a possible shipment figure through the end of the year of 593 million pounds, the industry would project a carry forward of just 495 million pounds. This would reduce the carry forward stock-to-use ratio (carryforward/yearly shipments) to 18.5%. Historically, a stock-to-use ratio below 20% indicates upward pressure on prices. In other words, it signals a tightening of supply below needs to meet demand. Buyers could be waking to the possibility that demand could remain strong and put real pressure on prompt shipments through the summer until harvest resupplies. They could be feeling the need to get shipments on the books before they risk rising prices. This could explain the divergence observed in monthly commitments we saw in April. And if strong shipments continue to materialize, this strategy could prove to have been quite the wise one as each additional shipment booked increases the premium on the next as inventory gets stretched.
Subjective Forecast
Perfect segue into talking about the Subjective Forecast as we all know that inventories will be replenished come harvest and to what degree we expect these supplies to be replenished will determine how much long term pressure there will be on prices. So what does the crystal ball of the Subjective Forecast portend?
The Forecast conveys two primary pieces of information. Regarding supply, it forecasts a yield of 3.0 billion pounds for the harvest upcoming. It also notes that bearing acres remain unchanged from a year ago. For now though, let’s focus on the supply figure.
The 3 billion pound figure is a large one and would represent a +21% increase YoY. 3 billion is also an emotional threshold and will immediately elicit memories of recent oversupply scenarios that have plagued the industry in recent years. But we should contextualize the yield estimate and add in our projected carryforward to project a total supply figure of 3.5 billion pounds and compare that to the total supply from a year ago, that, because of a larger carryforward, was not quite 3.2 billion pounds. Thus it is more appropriate to measure the increase in available supply at this forecasted level as closer to +9.5% [(3.5-3.2) / 3.2].
It should also be noted that growth in shipments wouldn’t need to grow quite at that rate to keep supply and demand in balance. As we mentioned earlier, balance has been observed when the carryforward stock-to-use ratio equals 20%. Knowing that shipments plus carryforward will equal total supply we can do some math using the 3.5 billion pound projected supply and calculate shipments and carry forward to meet a 20% stock-to-use figure. You can run the numbers if you’re so inclined, but it further reduces the shipment growth needed to 9.1%. Either way, 9-9.5% growth is still sizable, but for each additional pound sold in the current crop year, the less burden is placed on chasing growth the following year.
Where Does That Leave Us?
And this calculus assumes the forecast is accurate. The final yield will not be 3.0 billion pounds. It will invariably be larger or smaller than that. The question is over or under? Without increases to commodity prices, it will be under. Fertilization, pest management, irrigation, in reality all agricultural optimization practices are going to continue to come under budgetary scrutiny. Growers reeling from years of operating at a loss are going to continue to reduce their expenditures and many are going to continue to re-assess the viability of being in the industry at all. In short that will mean continued extreme pest pressures, stressed trees that can’t produce to their full potential, and abandonment of orchards altogether. A 3.0 billion pound forecast all but confirms this with little room for a narrative of tightening supply scenarios that would put significant enough pressure on prices to change growers’ fortunes. Growers that are on the edge will find no relief from this forecast and casualties will continue to follow.
For now, the industry may see price pressure in the short term for prompt shipments, especially if shipments continue to be strong. The Objective Forecast this summer will be another barometer and we will be watching to see how it might change the supply narrative. A combination of strong shipments and a sizable decline in expected yield could change the reality of the supply and demand balance in a hurry. Should that Black Swan appear, we’ll be here to help contextualize it.