April 2023 Almond Market Report
What Does the Position Report Say?
April’s Position Report shows that California Almond Handers shipped just over 197 million pounds in April. This is -19.6% below last April. This is also -29.8% below last month's near-record (2nd all-time) shipment figure of over 281 million pounds. Taken together however, March and April shipments are essentially flat YoY for the combined two month period falling just -2.4% behind.
Crop receipts in April exceeded that of last year helping nudge total receipts for the year above 2.56 billion pounds. This is relatively inconsequential, but many had thought we wouldn't surpass this number and many many have won/lost bragging rights. Receipts lag -11.75% behind last year at this time, while total supply, is just -3.05% behind last year due to the larger carry forward this year.
Total shipments on the crop year are +3.49% ahead of last year and computed inventory (sellable supply less total shipments) is -11.34% behind last year. Should demand growth hold neutral over the remainder of the crop year, the Industry could see a carry forward in the 650-750 million pound range. We’ll present some supply and demand scenarios later in the report.
Uncommitted inventory however is now +2.24% above last year’s figure at this time thanks to a modest 114 million pounds of new commitments being added in April. This is the slowest pace of any month since April 2018.
Some Market Context
Expectations for a smaller crop have been an Industry discussion point since bloom began in mid-February. We discussed poor weather conditions for bloom and early season growing in past reports and we saw Handlers begin pulling tonnage off the market as early as February as a result as evidenced by new monthly commitment levels falling below those of recent years. Meanwhile prices have climbed across all varieties and grades with increases surpassing +$0.40 in many cases over February figures. Shipments and commitments are slowing, but the price movement is a clear signal that slowing commitments and shipment figures should not be construed as a slowing demand. On the contrary, demand remains strong.
However, a valid question to ask might be: are Handler’s holding back too much inventory and could they be putting themselves into an undersold position? This is a reasonable question on the surface that effectively asks if supply restrictions are real or imagined. Or perhaps to better phrase: are they long term or immediate? Of course we know that markets are made up of both supply and demand so we need to look at both.
Supply and the Subjective Forecast
With the unfavorable weather this spring, the supply-side of the conversation has dominated the conversation. With today’s publication of the Subjective Forecast, supply is going to remain the primary discussion point. The forecast comes -3% bellow last year’s receipts with an expectation of a crop size of 2.5 billion pounds. This is higher than some Industry forecasts that came out this week generally forecasting 2.29-2.35 billion pounds which seemingly validated many growers’ concerns about an undersized crop. The Subjective Forecast authors however note that as forecasted, a per acre yield of 1810 pounds would be the lowest since 2005, so it needs to be noted that a 2.5 billion pound forecast is also acknowledging these same concerns. Whichever figure you ascribe to, the cool and wet spring weather has has clearly been a factor.
Before we move on and examine how the forecast might play out, we should note that as a mathematical model, the forecast should be viewed as a range and a model is never going to be precisely predictive. For reference, the Subjective Forecast from a year ago forecasted a crop of 2.8 billion pounds and we harvested 2.56 billion. We’re going to ignore these points for the sake of discussion and accept the 2.5 figure as common ground to further explore, but bare that in mind as we work through some of the following scenarios.
Assuming the forecast of 2.5 billion pounds, the Industry would need to target a carry forward of just 60-70 million pounds less than it did last year to have an equal supply next year. (Receipts + Carry Forward = Total Supply). This means a 750 million carry forward figure this year would put supply on par. Should the Industry maintain its current +3.49% annual shipment growth rate, carry forward would fall below 650 million. But now we’ve entered the demand side of the conversation, so let's investigate forward looking demand conditions.
Let's Discuss Demand
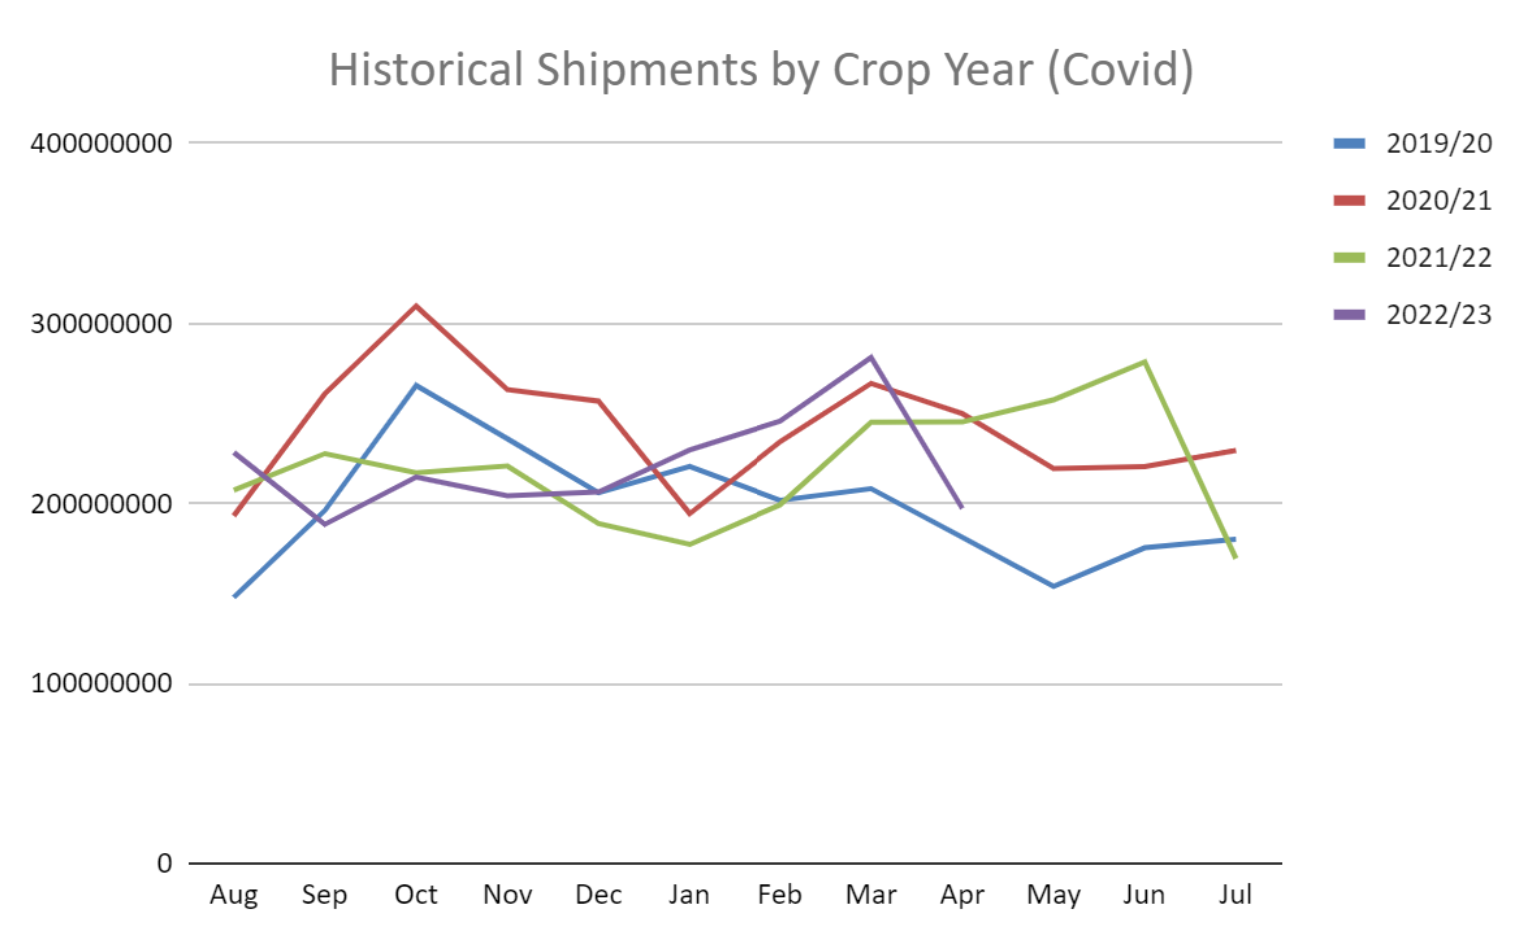
Consider the chart above charting monthly shipment numbers over the past four crop year. 2019/20 is representative of pre-Covid buying patterns with 2020/21 and 2021/22 seeing a shift in demand from the fall to the spring. We had expressed some uncertainty whether we’d see a similar pattern this year as logistic constraints and Covid restrictions normalized, but the chart illustrates that the Industry did in fact see a shipment peak in March as we had seen in previous Covid-impacted months. The question now is whether the rest of the year will look more like 2020/21 with waning shipments or like last year with a sustained push through the end of the year. The signs are pointing to something more reflective of 2020/21 where shipments plateau rather than grow. We're forecasting roughly 200 million pounds as an average in shipments per month through the rest of the year. Let us explain.
The seasonal transition is going to be later than normal this year. Cool spring weather has delayed almond development significantly and growers are running at least two weeks behind on average. This means the season is effectively going to be longer and the carry forward will need to cover more shipments than it might otherwise in a ‘normal’ year. This reality will impact buying to support holiday production in the EU and India fueling demand for transition shipments that will need to rely more on current crop than new crop to supply. Handlers will need to hold more inventory back to accommodate meaning there will be less available to sell in the short term.
Furthermore, the valley doesn’t have enough inshell to supply India’s demand, especially with China awakening and reentering the market (read Export Markets for more info). We should also consider the current environment growers who participate in call pools find themselves. Growers convinced of a short supply and of mind to favor Industry sentiment of a sub-2.4 billion crop yield, will be incentivized to hold back their tonnage from the market, assuming they can forgo the cash flow. This is especially attractive when current prices are historically very low (in spite of recent gains) and remain below a break-even for the grower. If call pool growers stay off the market, this perceived surplus tonnage won’t actually make it to market.
Export Markets
China continues to see its annual growth rate increase, moving from +19% on the year in March to +21% in April. Kernels continue to see the largest lift, up +47.1% for the crop year; but, inshell purchases have themselves surged of late. Inshell currently has a +6.4% growth rate for the year after April imports outpaced shipments from a year ago by +78.6%. China is roughly 1 million pounds off its total full crop year imports from the ‘21/22 season with three months of the crop year remaining essentially ensuring it will finish the year ahead of last year’s figures. Using a simple average of shipment weight per month projected forward would put China’s within range of its most recent shipment peak seen in 2017/18. If that seems a bit out of reach with inshell supplies tightening in California, consider that prior to last year, China had been importing effectively a 50/50 split between inshell and kernels with kernels accounting for 52.4% of the mix on average over the past 7 years. Currently kernel shipments account for just 39.3% which suggests that the strong growth we’ve seen over last year with the kernel segment is not just sustainable, but could well continue to grow. All of this is occurring without any tariff relief and its sustaining nature suggests that China’s reopening post-Covid could be the awakening of the sleeping dragon the Industry has long anticipated.
India imported over -8 million pounds less in April than it did a year ago representing a decline of -28.8% and remains in positive growth territory on the crop year at +2%. The short shipments seen in April is indicative of supply constraints more than anything else. China has reemerged and has been a strong buyer of inshell and California Handlers are running low on supply. Prices have increased from lows around $1.60/5 per pound to $2.20/5 signaling the realities of strong demand but short supply.
Further complicating supply constraints will be the delayed developing crop which will force more tonnage destined for holiday production to come out of an already tight supply for the current crop. Many buyers had been looking to other sources, chiefly Australia, but as their crop is off by as much as -25%, Indian buyers are finding it hard to cover themselves through the transition.
Western Europe imported -22.8 million pounds less in April than it did a year ago. This is a decline of over -33.3% YoY. The region went from pacing a +1% growth rate on the year in March to -4% in April. It had been pacing +10% growth as recently as the end of January. Spain was the primary driver of YoY declines seen in April with the country importing -19.2 million pounds less than it did a year ago. This is a drop of -61.2% YoY. This follows a -29% YoY decline seen in March shipments over the previous March. In February Spain was pacing a +17% annual growth rate on a nearly 100 million pound base at the time. That growth has evaporated in just two months and Spain now faces a -7% decline on the crop year.
Elsewhere in Europe, Germany was -900k pounds behind last year, but is a relative bright spot still posting growth on the year with a +6% figure. The Netherlands continues to be sluggish and is now just 500k pounds ahead of Italy, which itself is growing on the year at a +3% rate, for the 3rd largest Western Europe market. France continues to solidify itself as the 5th largest market in the region continuing its growth which now stands at a +28% annual rate.
We will continue to watch the region that has seen shipments from California experience some volatility over the past 12 months. Some of the buying interest may have moved to Australia, especially from buyers of higher end products looking for more recently harvested product, but Standard 5% prices have increased $0.40 this spring signaling continued demand.
The Middle East imported less than half (-51.1%) of the volume it did in March and lags behind April a year ago by -15.6 million pounds (-46.6%). The region has still imported nearly +26 million pounds more than it had through April a year ago, but significant declines in consecutive months could quickly erode that growth.
As the two largest markets in the region, the UAE and Turkey saw the biggest drops YoY in April of -63.6% and -44.4% respectively. Saudi Arabia saw growth of +5.6% YoY in April, but this was far below the annualized rate of +87% it had experienced through March. Jordan continued its strong growth with imports in April +43.8% above last year.
The region did just celebrate Ramada March 22nd thru April 20th, so it is possible that this suppressed shipments this month, but such a dip month to month during the holiday doesn’t seem consistent year to year. Then again the new markets that have been fueling recent growth may be more sensitive to the seasonal aspects of business. It’s also possible that the price increases the Industry has seen could be cooling off growth in these market. While almond prices remain historically low, other regions have not experienced the growth that the Middle East has and these new entrants to market could be more price sensitive than others. We’ll continue to monitor this region.
General Market Sentiments
A short crop has been validated to some degree with the release of the Subjective Forecast. Growers and Handlers though may be looking at a 2.5 billion crop that is forecast to be just -3% below last year as especially optimistic. The 2.57 billion pounds received this year was hampered by severe frost events in the northern growing regions, but this area accounts for less than 20% of annual almond harvest. While this is a meaningful amount, less impactful events affecting the remaining 80% of the growing regions could have a much more amplified impact on eventual harvest. Poor bloom and cold wet early season growing conditions impacted all regions in the state. As such it is hard to find growers who are reporting stronger crop sets that a year ago at this time. The widespread nature of these impacts carry the potential to have significant repercussions on event yield.
There are other factors causing skepticism of a 2.5 billion pound forecast as well. Stressed trees from years of drought and sub-optimal nutrient applications from years of severe budget restrictions are having visible impacts and can further suppress yields. Significant orchard removals are also occurring from years of stress and low commodity prices. Land IQ which provides acreage estimates run in line with Industry observers as falling below the figure that USDA-NASS relies upon for their Subjective Forecast. If you use these smaller acreage figures you'll figure right in line with Industry estimates in the 2.29-2.35 billion pound range.
The Industry will be targeting a 750-650 million pound carry forward with shipment figures for May-July under that of last year simply from a operational standpoint. Whether eventual receipts come in at 2.5 million pounds or closer to 2.29 million pound, the Industry will be much more in balance than it has been looking past the transition. Any acceleration in demand will only add additional pressure to prices.