April 2022 Almond Market Report
Strong Shipments
The April Position Report shows a strong April shipment total of 245.24 million pounds. This number was fueled by a record shipment number to export markets which topped 182 million pounds up +1.7% from a year ago. The domestic market was off -10.9% in April and is off -3.76% on the year. Export markets are off -17.08% on the year, while the Industry as a whole paces -14.95% behind last year’s net shipment numbers.
Net shipment figures continue to follow last year’s trend line supporting the narrative of a continued shift from historical buying trends. We expect current market conditions to support this trend moving forward through the end of the year. Meeting, or even seeing modest growth in shipment figures over the remaining quarter, is well within the realm of possibility.
The Industry currently has a marketable inventory over 1.526 billion pounds. Should we ship even with last year through the end of the crop year the Industry would have a carry forward right about 850 million pounds. This figure would be the largest on record, but aligns with previous Industry projections and doesn’t exacerbate oversupply concerns at the moment. This may change depending on the Subjected Forecast expected to be published on 5/12/22.
Future Demand
Committed shipments stands at +4.24% ahead of last year. New commitments for the month totaled 168 million pounds setting a new record for the month of April. An important caveat when evaluating the strength of forward demand in this case is that new crop commitments are not yet reported. These figures will be present on May’s Position Report. We will look to May's New Commitment figure to land between 20/21 and 21/22 to signal continued demand strength.
Current Trends
Computed inventory is 21.4% ahead of last year at 1.53 billion pounds. This over-supply scenario has been one that the Industry has been experiencing for some time and a record carry forward has been expected. With shipments trending the way they are, it is not unreasonable to expect shipments to be on par with that of last year. In such a case, carry forward would come close to 850 million pounds. This projects within our previous expectations while above historical levels. As his has been the industry expectation, we don't anticipate this number to further suppress prices. The publishing of the forthcoming Subjective Forecast may change this sentiment if it forecasts an oversized crop, but we’ll discuss that when it is published.
Not Quite a Forecast
Several Industry participants have published their own independent forecasts ranging from the low end of 2.5 billion pounds to 2.9 billion pounds. We’re not going to defend a number ourselves, but thought we’d share a couple of parameters to consider and some simple calculations.
Early season frost impacts have become clearer. The Northern Valley has been hit especially hard where temperatures fell well below freezing for extended periods of time over the course of several days. Many of our growers in the region are projecting losses exceeding -75% of last year’s yields. Some have expressed concern about even having enough to warrant harvest.
The Central Valley faired better, but pockets, especially on the West Side, are reporting damage. Others remain more optimistic and project a small boost over last year.
South Valley growers saw minimal to no frost damage, but continue to contend with water shortages and drought concerns. Consecutive years of water stress is likely to take the top end off of yields. The South represents 54.6% of the yield while the North represents 15.5% and the Central Valley 29.6%.
We should also consider that both Land IQ and USDA-NASS models project modest gains in bearing acres of +2.1% and +3.8% respectively. All else equal, this alone would increase crop expectations and can easily be factored in in simple projections.
So, let’s consider two possible scenarios. The first assumes the Central and South Valley perform as they did last year paired with a -70% reduction in the North. Let's factor in acreage increases using the larger 3.8% increase projected by USDA-NASS. The second scenario looks at the last 5 years and takes the lowest per acre yield over that time and projects forward using the USDA-NASS acre estimate.
Scenario 1:
Assumptions: 3.8% Increase in bearing acres; -70% yield reduction in Northern Region; Center and South at previous yield/acre.
Result: 2.873 billion
Scenario 2:
Assumptions: 3.8% Increase in bearing acres; 2090 lbs/acre yield
Results 2.796 billion pounds
Again, neither scenario is meant to be a forecast, but a benchmark. The upcoming Subjective Forecast will be a much better barometer and we will provide our take when it is published.
Drought
Dry conditions persist across the whole of California as the third year of drought intensifies concerns about water resiliency. As reported by Weather.com, the first four months of the year saw a statewide average of just 25% of normal precipitation and ranks as the driest on record. Warm weather and a lack of snowfall in the mountains caused the snow pack to peak three weeks earlier than normal at just 57% of average depth. As of May 10th the state’s snow pack was just 22% of normal despite a few recent weather systems passing through the area.
Lake levels remain at critically low levels. California’s largest reservoir, Lake Shasta, is at its lowest level to begin May since the 1976-1977 water year. Lake Oroville sits at 70% of it’s historical average at just 55% of capacity, though this is an improvement over last year. Across all California reservoirs, storage as of May 10th is on par with last year, off just -0.25%. While the snow pack is an improvement over the 8% we saw this time last year, it is clear that strong replenishment of California’s reservoirs is not in the cards.
Extreme drought conditions extend well beyond California with the Western US in a historically severe megadrought and considered the worst in at least 1200 years. The two largest reservoirs in the US, Lake Mead and Lake Powell on the Colorado river are both at historical lows as well, prompting warnings of water shortages from New Mexico to California. As another indication of the severity of current conditions, urban water restrictions have been implemented statewide with some of the most restrictive being implemented by the Metropolitan Water District of Southern California that supplies water to vast portions of the greater Los Angeles area. One day a week outdoor watering begins on June 1 and the district is prepared for an outright ban if reductions of -38% aren’t achieved.
Agricultural water users will also face shortages again this year. The Federally run state water project maintains a 0% surface water allocation and many local water districts are also facing shortages. Those relying on ground water supplies must contend with shrinking reserves and/or subprime water quality raising the risk of tree stress and kernel damage as the season progresses.
Export Markets
Export markets saw their first monthly YoY growth since August 2021 setting a new record for April with 182.8 million pounds shipped. This represents a +5.6% growth rate over March and reverses the -8.0% decline March to April that export markets saw last year. These are positive signs in general where export markets continue to be off -17.08% on the crop year.
India imported +29.5% more almonds in April than it did a year ago and improved on the year to pace -14%. The acceleration is one we have been expecting with the early Diwali season forcing purchases to come out of the current crop year. The strengthening shipment numbers to India is a welcome sign of continued demand from the subcontinent. Supply chain issues persist and are likely suppressing India’s full potential, but it’s clear that some lanes remain open. Elevated shipment numbers are likely to continue for the short term, but are likely to begin to fall back in line as buyers and processors in the sub-continent secure their supplies for the festival season.
China was off -31.8% YoY in April and flat MoM. Inshell saw the largest decline off -39.1%. This was an area where optimism for growth was high after seeing an acceleration in March and the perception that Inshell from Australia was not up to their specification. Kernels however saw significant growth MoM topping +73.9%. China on the whole remains off -27% on the year and continues to prove it is a hard market to read.
Western Europe retained recent demand acceleration seen over the past few months. In March YoY growth was at -1.1%. In April this slipped slightly to -1.7%. This has cut the region’s deficit from a -18% YTD growth rate in March to -16% in April. Individual markets however paint a far more inconsistent picture.
Spain imported over 31 million pound in April. This is a +66.6% increase YoY. Italy as well saw significant growth up +27% YoY. The Netherlands however was off -17.1% YoY while the other two top five Western Europe markets of Germany and the UK were both off -48%. These are some significant swings and might require some context. Below we have included a table with the last three months of comparative growth with a net figure over this timeframe, as well as, a table referencing each market’s current YTD growth rate.
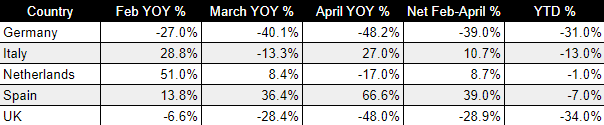
What the chart helps illustrate is that Germany and the UK have been taking less almonds and the degree to which this is happening is intensifying. Spain, the Netherlands and Italy all show positive growth over this time period while remaining under last year on the full crop year to date. This would indicate stronger relative demand over the first half of the crop year. The Netherlands seems to be trending in a slowing direction while Spain has accelerated significantly. Why each of these markets may be experiencing these different, yet significant, trends may require additional investigation and we will continue to monitor.
The Middle East as a region is up +51.2% importing over +11 million more pounds in April than a year ago. Saudi Arabia, Turkey and the UAE all saw growth exceeding 42% with Turkey doubling YoY by importing over 10 million pounds. This is a sharp reversal from -44.9% and -25.1% growth rates the region saw in February and March respectively. With the strong month, the region moves from a YTD pace of -24% seen in March to -15% in April.
What's on the Horizon
The Subjective Forecast is the next major barometer for the Industry and is set to be published on 5/12/22. Frost and drought concerns have long kept expectations moderated. While the Subjective Forecast relies on surveys and is prone to emotional misjudgments and inaccuracies, it is a reasonable gauge of the grower community and how they are planning. Consensus from our sources seems to suggest the expectation is a number near 2.8 billion pounds. Should the forecast swing one way or another in a meaningful way, we could see the market react accordingly. When the forecast is published, we will follow up with our analysis with a supplemental report. We welcome you back tomorrow.
How to Kill Time
Antsy waiting for the Subjective Report? Why not listen to the latest NutNews Podcast. This month CEO of the Almond Alliance, Aubrey Bettencourt joins and lends us insights into the role the Almond Alliance plays in advocating for our industry. We discuss some of the tough issues, like water supply and logistics, from the perspective of the Alliance. Come take a listen!